|
Dr. Sakshi Sharma Assistant Professor MM Institute of Management Maharishi Markandeshwar University Ambala-Yamunanagar Highway Mullana, Ambala, Haryana |
The present study assessed the impact of work support, work autonomy, and work ambiguity on work life balance of doctors. The path model by using data from 141 doctors employed in government hospitals of Himachal Pradesh. Confirmatory Factor Analysis was executed to confirm the fitness of data of the proposed measurement model. Convergent validly, discriminant validity along with composite reliability were estimated to ensure reliability and validity of the scales used. Finally, Structured Equation Modeling was used to test the hypothesis of the study. The findings of the study reported significant influence of work support, work autonomy on work life balance of doctors.
Keywords: Structure Equation Modelling, Work Life Balance, Work Autonomy, Work Support, Work Ambiguity, Work Life Balance Doctors
Work-family balance is often replaced by the term work-life balance (WLB). Work life balance is much broader concept than work-family balance in the sense, that it encompasses multiple roles outside family life e.g. community, leisure and religious roles, that an individual engages in (Frone, 2003). There is no apparent agreement on the meaning of the term. Although most definitions of work life balance include the concepts of flexibility, juggling and sustainability, however it is most frequently used to describe the equilibrium between responsibilities at work and responsibilities outside paid work. In the WLB literature, Clark (2001) defines work-family balance as “satisfaction and good functioning at work and at home with a minimum of role conflict.” Greenhaus, Collins and Shaw (2002) define work-family balance as “the extent to which an individual is equally engaged in - and equally satisfied with – his or her work role and family role.” Frone (2003) define work-life balance as “the absence of conflict between work and family or personal roles”. David, Harikrishnan and Monickam (2012) define work life balance as “a self defined, self determined state of well being that a person can reach or can set as a goal that allows them to manage effectively multiple responsibilities at work, at home and community.”
Work autonomy is the amount of freedom given to the employees. The freedom can be in terms of scheduling the participated in the study. Total population of doctors in the Work autonomy is the amount of freedom given to the work or deciding the procedure to be used for effectively carrying out the work (Van Valdhoven, et al., 1997). to Billing, et al. (2012) noted that employees are able to achieve better work-family balance if they have adequate job autonomy in performing the duties and responsibilities associated with the job. Grzywacz and Butler (2005) found that individuals with jobs high in autonomy experienced higher levels of work-family facilitation. Grzywacz and Marks (1999) suggested in their study that resources that assist in development in work or family settings such as autonomy in job are associated with less work-family conflict. Work ambiguity occurs when employees are unclear regarding the goals, expectations or responsibilities associated with the performance of their positions. Ryan Emily and Cathy Ku (2009) identified role ambiguity as the most important determinant for work- family conflict. Michel, et al. (2011) found work role ambiguity as an antecedent to work-family-conflict. Bennett (2012) found work role ambiguity to be related to work-interference-with-family conflict. On the same note, Ryan Emily and Cathy Ku (2009) identified role ambiguity as the most important determinant for work-family conflict. Social support at work assists individuals to manage diverse role requirements by imparting solutions in order to bear the responsibilities at work (Kyoung-Ok, Wilson and Myung, 2004). Walsh (2012) reported that work to life interference was related to job burnout and management support attenuated job burnout. Also support from co-workers had beneficial effects in reducing job burnout. Thompson and Prottas (2006) found support from supervisors and co-workers to be positively related with work-to-family enrichment. Grzywacz and Marks (1999) opined that resources that assist in development in work or family settings such as support at work from colleagues and supervisors are associated with less work-family conflict. From the above review, hypothesis 1, hypothesis 2, and hypothesis 3 are formulated as:
Work autonomy influences work life balance of doctors.
Work ambiguity influences work life balance of doctors.
The study is primarily based on primary data. Data for the study was obtained from 141 doctors working in government hospitals of Himachal Pradesh. Doctors of six public hospitals namely Kangra, Mandi, Shimla and Solan the participated in the study. Total population of doctors in the given hospitals were 503. Questionnaires were distributed ). to 215 doctors. Sampling technique used for the study was judgement sampling. 141 questionnaires were returned by the respondents yielding a response rate of 65%. A structured questionnaire was used as an instrument for the study. The items selected for the study were adopted from available scales. Work Autonomy consisted of eleven items which indicated the extent to which they employees' could control their work situation. Items were answered on a five point response scale, ranging from 0 (Never) to 4(Always). All measures were adopted from Van Valdhoven, et al. (1994). Work Ambiguity consisted of five items. The scale included 5 items, asking respondents to indicate the extent to which they are clear about the expectations or responsibilities associated with their positions, Items were answered on a five point response scale, ranging from 0 (Never) to 4 (Always). Higher score on work ambiguity scale implied less work ambiguity i.e., clear understanding of employees' job responsibilities. All measures were adopted from Van Valdhoven, et al. (1994). Work Support consisted of four items. Caplan, et al. (1975) was used to measure the work support. In the present research perception of support from co-workers was measured. Respondents were asked to state the extent of support they received from each source on a five-point Likert scale ranging from 1 (Strongly disagree) to 5 (Strongly agree). All measures were adopted from Caplan, et al. (1975). Work Life Balance consisted of seven items. The responses were solicited using a seven point time related scale (e.g. 1=Not at all, 4= Sometimes, and 7=All the time). All measures were adopted from Hyman (2005). The tools used for data analysis consisted of Structured Equation Modelling (SEM) including Confirmatory Factor Analysis (CFA) using AMOS 24.
A measurement model of the construct and their respective explaining variables was developed as shown in Fig 1. The variables and their constructs Confirmatory Factor Analysis was conducted in two steps. First, CFA was conducted for each factor of the measurement model. Step CFA was conducted for all the factors together in order to get the final measurement model. To assess model fit, multiple fit indices were used. Some of the indices used were: Chi Square test, Chi Square / df ratio, Comparative Fit Index (CFI), Goodness of Fit Index (GFI), Root Mean Square Error of Approximation (RMSEA). For model improvement, indices used were: Standard Regression Weights and Modification Indices. The following acceptance values of goodness-of-fit indices were used for assessing the model fit: Comparative Fit Index (CFI: <.80 unacceptable, .80 to .90 acceptable, >.90 good), Goodness of Fit Index (GFI: <.80 unacceptable, .80 to .90 acceptable, >.90 good), Root Mean Square of Approximation (RMSEA: <0.05 good; <0.10 acceptable, >0.10 poor). For model improvement, acceptable values were: Standard Regression Weights >.06 and Modification Indices <.10. After performing CFA, variables strongly defining the constructs have been retained and the variables that weekly defined the constructs were dropped. With the variables retained, SEM depicting caused and effect relationship was developed. Results for work autonomy Work autonomy consisted of eleven measurement items (WA1, WA2, WA3, W4, WA5, W6, WA7, WA8, WA9, WA10, WA11) for CFA. The result of the work autonomy is shown in Table 1.
| No.of item | C(df) | C/df | CFI | GFI | RMSEA | Remarks | |
|---|---|---|---|---|---|---|---|
| Initial Model Results | 11 | 142.76 (44) | 3.24 | .84** | .85** | .12** | |
| Final Refined Model Results | 8 | -23.62(18) | 1.29 | .99* | .96* | .04* |
From the results of Table 1, RMSEA indicated unacceptable values for model fitness. Therefore, model improvement was done. SRW for items WA3 (.54), WA5 (.29), and WA9 (.42) was less than 0.6. In addition, MI between WA10 and WA11 (24.51), WA7 and WA8 (19.34) was high. Therefore, items WAut3, WAut5, and WAut9 were eliminated and items WAut10 and WA11 and items WA7 and WA8 were correlated. CFA was run again. The value of CFI, GFI and RMSEA in the final model showed good fit for work autonomy factor.
Work support consisted of five items (WS1, WS2, WS3, WS4) for CFA. The results of CFA are shown in Table 2.
| No.of items | χ2 (df) | χ2/df | CFI | GFI | RMSEA | Remarks | |
|---|---|---|---|---|---|---|---|
| Initial Model Results | 4 | 1.86(2) | .933 | 1.0* | .99* | .00* | |
| 4 | - | - | - | - | - | - |
CFI, GFI and RMSEA values showed good fit for work support factor. Thus, the model improvement was not required.
Work support consisted of five items (WA1, WA2, WA3, WA4, WA5) for CFA. The results of CFA are shown in Table 3.
| No.of item | χ2 (df) | χ2/df | CFI | GFI | RMSEA | Remarks | |
|---|---|---|---|---|---|---|---|
| Initial Model Results | 5 | 5.73(5) | 1.147 | .99* | .98* | .03* | |
| Final Refined Model Results | 4 | 1.06(2) | .534 | 1.0* | .99* | .00* |
From the results of Table 3, CFI, GFI and RMSEA values showed good fit for work support factor. However, SRW for WA2 (.55) was less than 0.6. Thus, the model improvement was required. Therefore, item WA2 was removed from the model. CFA was conducted again. The values of CFI, GFI and RMSEA in the final model showed good fit for work ambiguity factor
Work support consisted of seven items (WLB1, WLB2, WLB3, WLB4, WLB5, WLB6, WLB7) for CFA. The results of CFA are shown in Table 4.
| No.of items | χ2 (df) | χ2/df | CFI | GFI | RMSEA | Remarks | |
|---|---|---|---|---|---|---|---|
| Initial Model Results | 7 | 67.47(14) | 4.82 | .93* | .87* | .16*** | |
| Final Refined Model Results | 6 | 16.11(7) | 2.30 | .98* | .96* | .09** |
From the results of Table 4, RMSEA indicated unacceptable values for model fitness. Therefore, model improvement was done. SRW for item WLB7 was less than 0.6. In addition, MI between WLB1 and WLB2 (22.37), WLB4 and WLB5 (11.80) was high. Therefore, item WLB7 was eliminated and items WLB1 and WLB2, and items WLB4 and WLB5 were correlated. CFA was conducted again. The value of CFI, GFI and RMSEA in the final model showed good fit for work life balance factor.
After running CFA for every factor in Step 1 of measurement model testing, CFA was performed for all factors combined in next step i.e. Step 2. In this step, all the individual scale items were loaded on their respective factors and all factors were correlated with each other. The overall measurement model consisted of four factors measured by 22 scale items. The results of the overall model are shown in Table 5.
| No.of items | χ2 (df) | χ2/df | CFI | GFI | RMSEA | Remarks | |
|---|---|---|---|---|---|---|---|
| Initial Model Results | 22 | 386.43(199) | 1.942 | .91* | .81* | .08** | |
| Final Refined Model Results | 20 | 303.70(161) | 1.886 | .93* | .83* | .08** |
The values of CFI, GFI and RMSEA indicate that the measurement model fit is acceptable. Chi square divided by degrees of freedom is >5 (Bentler, 1989) which suggested acceptable model fit. However, SRW for WAut10 (.54) was below 0.6. In addition, WA5 was found to be associated with items from other constructs (MI between WAmb5 and WA1 is 12.28). Therefore, WA10 and WAmb5 were eliminated from the model and CFA was conducted. The values of CFI, GFI and RMSEA were found acceptable in the refined model results. The final mode consisting of 20 items was taken as the structural model of the study for testing the research hypothesis.
| S.NO | Factors | Scale Item No. | Item Reliability | CR | AVE |
|---|---|---|---|---|---|
| WA1 | .73 | ||||
| WA2 | .74 | ||||
| WA4 | .75 | ||||
| WA6 | .68 | ||||
| WA7 | .72 | ||||
| WA8 | .62 | ||||
| WA11 | .70 | ||||
| WS1 | .80 | ||||
| WS2 | .85 | ||||
| WS3 | .93 | ||||
| WS4 | .93 | ||||
| WAmb1 | .58 | ||||
| WAmb3 | .70 | ||||
| WAmb4 | .81 | ||||
| WLB1 | .79 | ||||
| WLB2 | .86 | ||||
| WLB3 | .86 | ||||
| WLB4 | .87 | ||||
| WLB5 | .85 | ||||
| WLB6 | .86 |
The individual scale items reliability is shown in Table 6. Reliability refers to the extent to which a scale produces consistent results if repeated measurements are made on the characteristic (Malhotra, 2004). The items were found to be reliable as the value of squared correlation between the scale item and its corresponding factor was ≥ 0.5.
The factor is considered reliable when it has internal consistency value above the recommended threshold of .70 (Nunnally and Bernstein, 1994). The composite reliability (CR) values for the factors were .87 for work autonomy, .93 for work support, .74 for work ambiguity and .93 for work life balance. Hence, factors in the study were reliable.
Construct validity includes convergent validity and discriminant validity. Convergent validity is the extent to which the scale correlated positively with the other measures of the same construct. Convergent validity is reflected by Average Variance Explained greater than 0.50. In the present study, work support had highest AVE (.783) and work ambiguity had lowest AVE (503) (see Table 6).
| Support | Autonomy | WLB | Ambiguity | |
|---|---|---|---|---|
| Support | 1.000(0.885) | |||
| Autonomy | 0.399 | 1.000(0.710) | ||
| WLB | 0.486 | 0.593 | 1.000 (0.847) | |
| Ambiguity | 0.571 | 0.697 | 0.493 | 1.000 (0.709) |
Discriminant validity indicates the degree to which a scale item of a factor does not correlate with other factors. Table 7 indicates the discriminant validity values of all the factors were greater than the corresponding correlation using AMOS 24 to test the hypothesis formulated.
SEM of the study developed from CFA was also tested for coefficients of the factors. Thus, all the factors satisfied the validity concerns.
The structural model specifies how the variables are related to each other. SEM was conducted on structural model its fitness. To evaluate the structural model, goodness-of-fit indices were assessed. The results of the model fit indices are depicted in Table 8. The values of CFI, GFI and RMSEA were all acceptable and therefore the model fits the data reasonably. The path diagram of the final refined structural model is shown in Figure 3.
Table 8: Fit Indices of the Structured Model| ÷2 (df) | ÷2/df | CFI | GFI | RMSEA |
|---|---|---|---|---|
| 315.17 (163) | 1.93 | .*92 | .83** | .08** |
The results of the regression coefficients of SEM arepresented in Table 9. The regression coefficient of work output are presented in Figure 3. From the results, it can be support (.474) and work autonomy (.842) is positive and inferred that work support and work autonomy have statistically significant. Thus the hypotheses H1 and H2 are supported. However, the regression coefficient of work ambiguity is not statistically significant. Thus, hypothesis H3 is rejected. The standardized regression weights of the output are presented in Figure 3. From the results, it can be inferred that work support and work autonomy havesignificant influence on work life balance of doctors.
Table 9: Regression coefficients and other statistics| Hypothesized path | Regression Coefficients | Standard Error | Critical Ratio | P | Hypothesis Test |
|---|---|---|---|---|---|
| Work SupportWLB | .440*** | .143 | 3.081 | *** | Accepted |
| Work Autonomy WLB | .676*** | .184 | 3.669 | *** | Accepted |
| Work Ambiguity WLB | -.034 | -.034 | -.110 | .913 | Rejected |
The present study aimed to investigate the influence if work support, work autonomy and work ambiguity on work life balance of doctors. The study hypothesized that: (1) work support influences work life balance of doctors, (2) work autonomy influences work life balance of doctors, and (3) work ambiguity influences work life balance of doctors. The relationship between work support, work autonomy, work ambiguity and work life balance was investigated using Structural Equation Modelling. The findings of the study show significant influence of work support on work life balance. Also, work autonomy also had a significant influence on work life balance of doctors. However , work ambiguity had no influence on work life balance of doctors.
In the present study, work support from co-workers was studied. Work support was found to have a significant influence on work life balance of doctors. Willingness from co-workers to provide adequate moral support in job can reduce the intrusion of work problems in employees' family lives. Sergerstrom, Smith and Eisenlohr-Moul (2011) contended that the quality of relationship and support from managers, superiors and co-workers is important for safeguarding the harmful effects of work- related stressors. Therefore, supportive workplace environment is important for employees' to live a balanced work life. The study also found work autonomy as an important determinant influencing the work life balance of doctors. According to Gagne and Deci (2005), autonomy is an important factor intrinsic as well as for extrinsic motivation. High decision latitude, within job demands and job resources leads to the “development of new behaviour patterns on and off the job” such as proper work life balance (Karasek, 1979).The findings of the study corroborates previous research by Beauregard and Henry (2009) who suggested that supporting positive job-related attitudes, such as the possibility to act autonomously and make independent choices within one's work environment leads to balanced work life.
Bennett, M. M. (2012). A deeper look at the antecedents of work-family conflict: The effect of generational theory and life cycle stages (Dissertation, Central Michigan University, U.S.). Retrieved from
Billing, T. K., Ford, D. L., Srivastava, B. N., Rajadhyaksha, U., Shin. M., Kuo, B., Kwantes, C., Setiadi, B., & Nasurdin, A. M. (2012). Work–family conflict and organisationally valued outcomes: The Psychological Association
Gagne, M., & Deci, E. L. (2005). Self-determination theory and work motivation. Journal of Organizational Behaviour, 26(4), 331-362.
Greenhaus, J. H., Collins, K. M., & Shaw, J. D. (2002). The relation between work family balance and quality of life. Journal of Vocational Behavior, 63(3), 510- 531
Grzywacz, J. G. & Marks, N. F. (1999). Reconceptualizing the work-family interface: an ecological perspective on the correlates of positive and negative spillover between work and family. Journal of Occupational Health Psychology, 1, 111-126.
Grzywacz, J. G., & Butler, A. B. (2005). The impact of job characteristics on work-to-family facilitation: testing a theory and distinguishing a construct. Journal of Occupational Health Psychology, 10 (2), 97–109
Hyman, J. (2005). Psychometric assessment of an instrument designed to measure work life balance. Research and Practices in Human Resource Management, 13(1), 85-91.
Karasek, Jr, R. A. (1979). Job demands, job decision latitude, and mental strain: Implications for job redesign. Administrative Science Quarterly, 24,
Kyoung-Ok, P., Wilson, M. C. & Myung S. L. (2004). Effects of social support at work on depression and organizational productivity. American Journal of Health Behavior, 28(5), 444-455.
Malhotra, N. K., Kim, S., & Agarwal, J. (2004). Internet Users' Information Privacy Concerns (IUIPC): The Construct, the Scale, and a Causal Model. Information Systems Research, 15(4), 336-355.
Michel, J. S., Kotrba, L. M., Mitchelson, J. K., Clark, M. A., & Baltes, B. B. (2011). Antecedents of workfamily conflict: A meta-analytic review. Journal of Organization Behavior, 32,689-725.
Ryan, B., Emily, J., & Cathy Ku, M. (2009). Role conflict, role ambiguity and work-family conflict among university foodservice managers. International CHRIE Conference-Refereed Track. Paper 17.
Sergerstrom, S. C., Smith, T. W., & Eisenlohr-Moul, T. A. (2011). Positive psychophysiology: The body and self-regulation. In K. M. Sheldon, T. B., Kashdan & M. F. Steger (Eds.), Designing positive psychology: Taking stock and moving forward (pp. 25-40). New York: Oxford University Press.
Thompson, C. A., & Prottas, D. J. (2006). Relationships among organizational family support, job autonomy, perceived control, and employee wellbeing. Journal of Occupational Health Psychology, 11(1), 100-118.
Van Veldhoven, M., & Meijman, T. F., Broersen, J. P. J., Fortuin, R. J. (1997). Handleiding VBBA: Onderzoek naar de beleving van psychosociale arbeidbelasting en werkstress met behulp van de vragenlijst beleving en beoordeling van arbeid. [VBBA manual: An investigation of perceptions of psychological workload and work stress by means of the survey perception and assessment of the work situation.] Amsterdam: SKB.
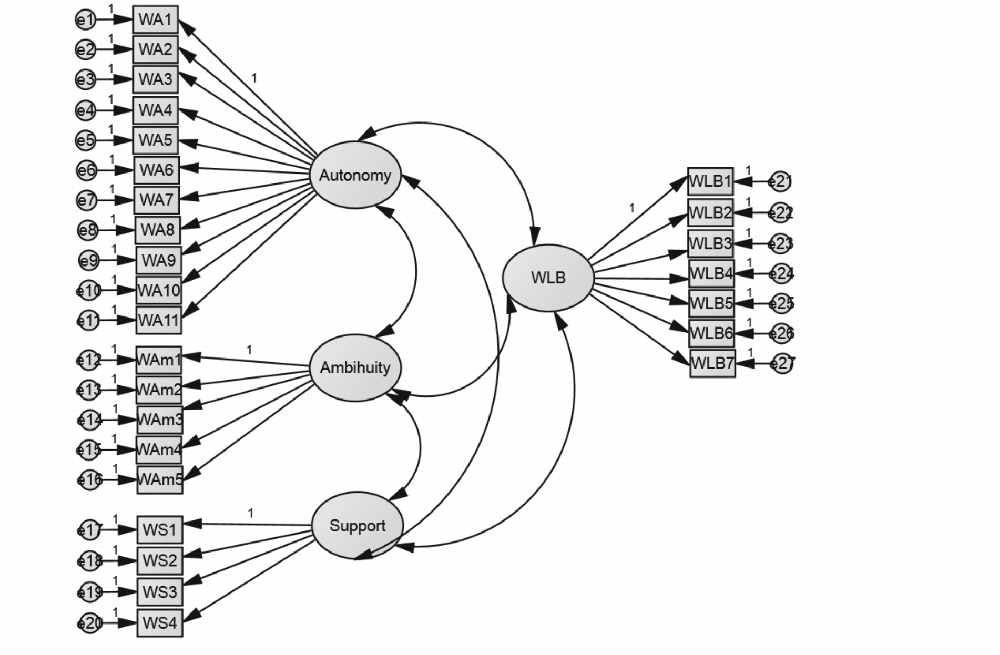 Figure 1: Path Diagram of Proposed Measurement Model
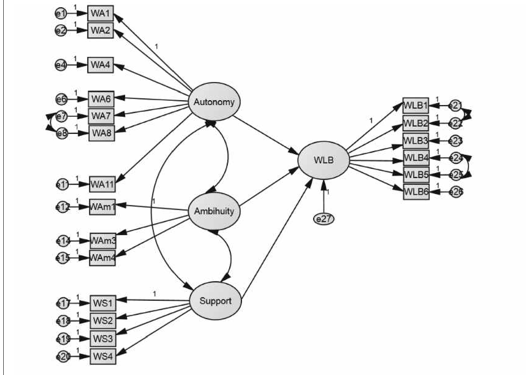 Figure 2: Path Diagram of Structural Model
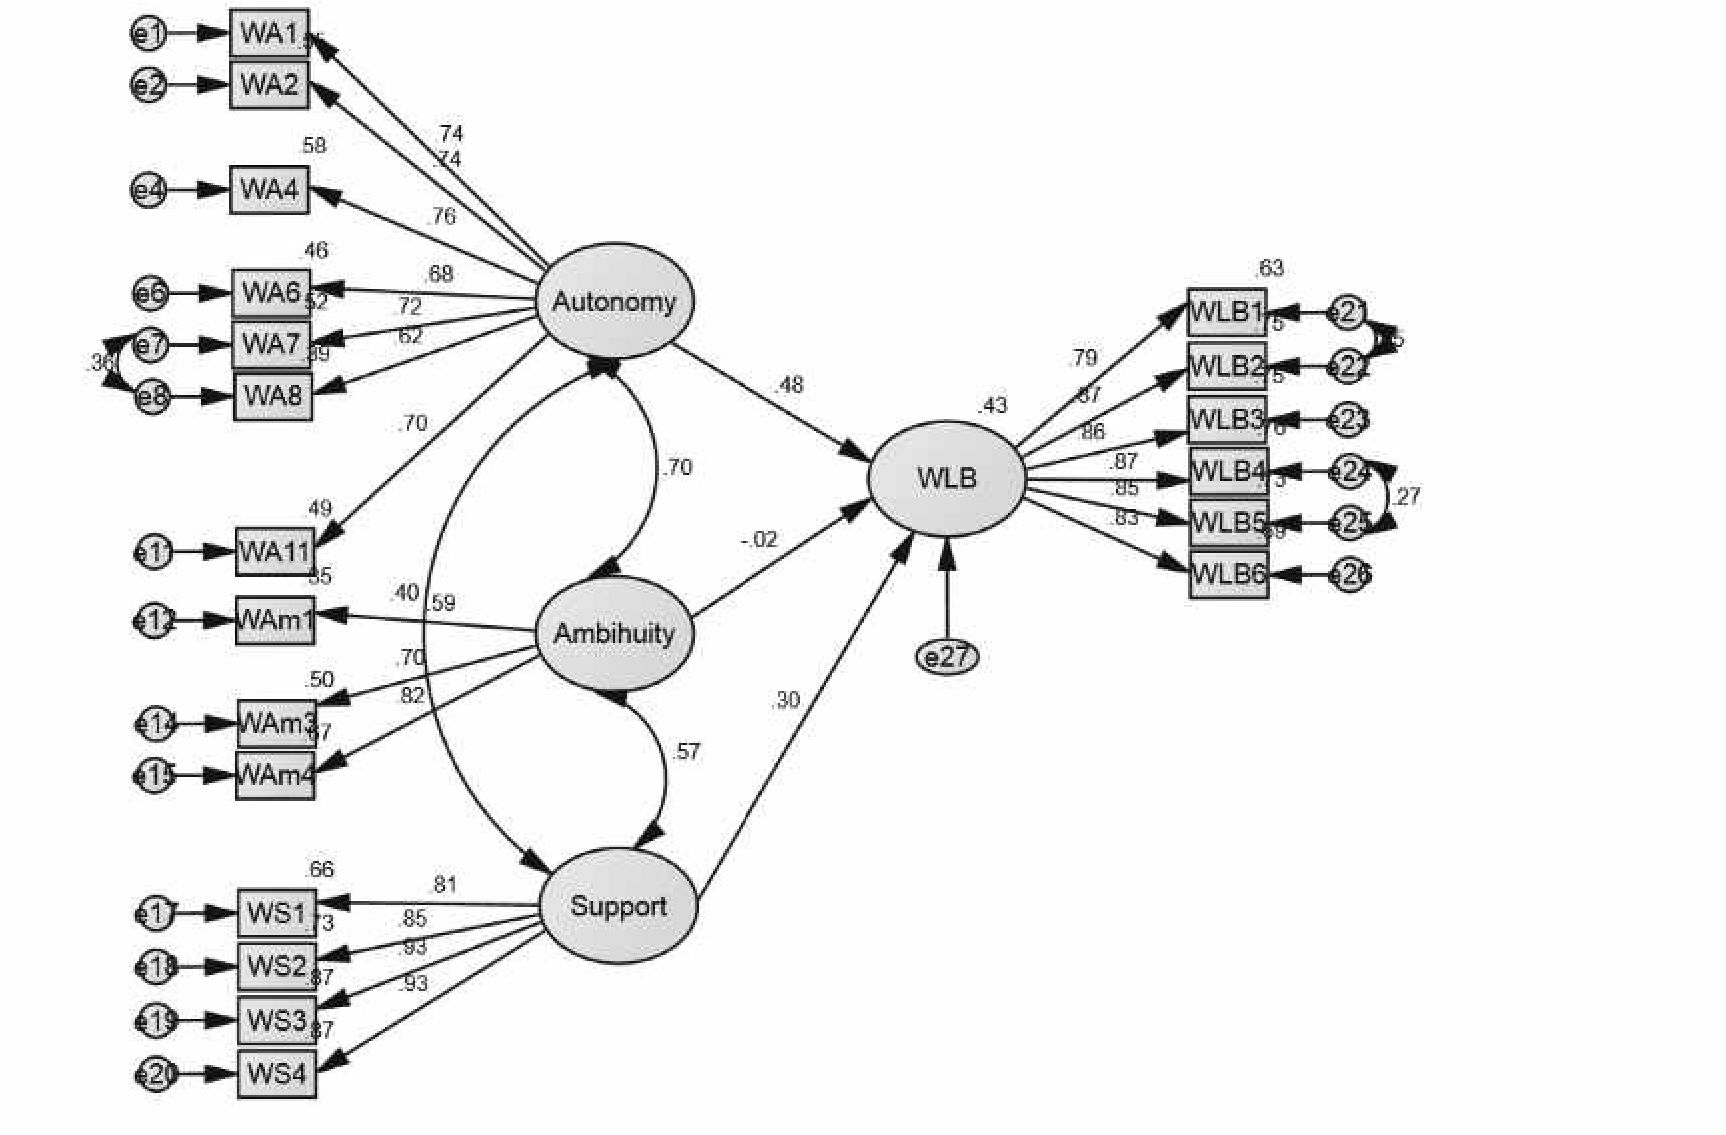 Figure 3: Structural Model with Standardized Estimate

