|
Prof. Moumita Chatterjee [Corresponding Author] Assistant Professor - Adamas University, Kolkata, India India +91 9830705971 Home Address: GD182, Sector 3, Saltlake, Kolkata- 700106 mourum1512@gmail.com |
Prof. (Dr.) Madhumita Mohanty Professor –IISWBM, Kolkata, India +91 9830064767 drmadhumitamohanty@gmail.com |
This study is aimed to examine the relationship between leadership behavior (leadership style, spiritual intelligence, psychological capital, job satisfaction, perceived ethicalism) and perceived leadership effectiveness of corporate leaders in Kolkata, India in VUCA world. A random sample of 481 corporate leaders is studied, among which 273 are transformational, 164 are transactional and 44 are laissez-faire leaders. Six standardized scales are used to collect primary data from the corporate leaders in Kolkata. The result of Multiple Regression Analysis shows that in case of transformational corporate leaders, transformational leadership style, spiritual intelligence, psychological capital and perceived leaders’ ethicalism from subordinate’s view point are significant predictors and their job satisfaction is insignificant predictor in determining their perceived leadership effectiveness in Kolkata, India in VUCA world. In case of transactional leaders, spiritual intelligence, psychological capital and leader’s ethicalism are significant predictors and their transactional leadership style and job satisfaction are insignificant predictors in determining their perceived leadership effectiveness in Kolkata, India in VUCA world. In case of laissez-faire corporate leaders, laissez-faire leadership style and job satisfaction are insignificant predictors but spiritual intelligence, psychological capital and perceived leader’s ethicalism are significant in predicting their leadership effectiveness in Kolkata, India in VUCA world.
Keywords: Perceived Leadership Effectiveness, Corporate Leaders, Spiritual Intelligence, Psychological Capital, Job Satisfaction, Perceived Ethicalism
A company's corporate leadership is composed of the top executives who oversee its operations and plot its strategies for the future in order to achieve success and influencing change among the company's workforce. Leadership in business is the capacity of a company's management to set and achieve challenging goals, take decisive action when needed, and inspire others to perform at the highest level they can. An evil leadership can bring massive destruction to the organization. VUCA (volatility, uncertainty, complexity, and ambiguity) describing the realities businesses face today which has ushered in a new standard of leadership since the survival of a business depends on leadership trained for a VUCA world
Transformational leaders are proactive and consist of active factors of charisma, inspirational motivation, idealized influence, and individualized consideration and intellectual stimulation. Transactional leadership concentrates on the exchanges that occur between leaders and their followers (Northouse, 2007), which helps the follower to fulfill their own self-interests (Bass, 1999) and consists of the active factors of contingent-reward and active management-by exception. A laissez faire leader gives followers the opportunity to make decisions.
Spiritual Intelligence is the expression of the innate spiritual qualities through one’s thoughts, attitudes and behavior and the ability to see everyone as spirit, and thereby, transcend all the false identities.
Psychological Capital is an individual’s positive psychological state of development which is characterized by self-efficacy, optimism, hope and resiliency to attain success (Luthans, Youssef et al., 2007).
Job satisfaction is the level of contentment a person feels regarding his or her job.
Ethicalism is a simple code of ethics which paves the way for one to be a good human being in a challenging world which is related with a leader’s identity and the roles which are measured by perceived integrity of the leaders from his/her subordinate’s view point.
Leadership Effectiveness must result in enabling and empowering the team of people to accomplish the desired task and effective leaders successfully guide the organization through continuous development and influence their organization’s effectiveness by inspiring the workforce
Ramachandaran et al. (2017) revealed effectiveness of integrating spiritual intelligence into women academic leadership practices and explained how spiritual intelligence when translated through leadership practice would contribute to a more balanced and harmonious working environment. Sultan et al. (2017) revealed that the spiritual intelligence was significantly related to leadership effectiveness and personality traits of extroversion and openness to experience in Multan. Chi and Chi (2014) indicated that honesty, authenticity, sincerity, respect and righteousness were major virtues to make up this leadership integrity by using structural equation modeling. Pihie (2012) demonstrated that contingent reward, idealized influence, inspirational motivation, individualized consideration, laissez faire, intellectual stimulation, and active management-by-exception were significant predictors of leadership effectiveness. Hooijberg, Hooiiberg and Diverse (2010) indicated the impact that integrity had an impact above that of leadership behaviors on perceived effectiveness for managers and their peers but not for their direct reports and bosses. Lean (2008) examined the impact of a team leader’s integrity on his or her subordinates’ behavior that indicated an interaction between leaders’ integrity and team members’ ethical intentions. Brown and Trevino (2006) focussed on the emerging construct of ethical leadership and compared this construct with related concepts that shared a common concern for a moral dimension of leadership (e.g., spiritual, authentic, and transformational leadership).
In the context of studies related to various leadership behavior and leadership effectiveness, there are controversies to identify the predictors of leadership effectiveness of corporate leaders in Kolkata by their various leadership behaviors. These limitations create the need to develop an empirical study to get a more conclusive finding to clarify several contradictions.
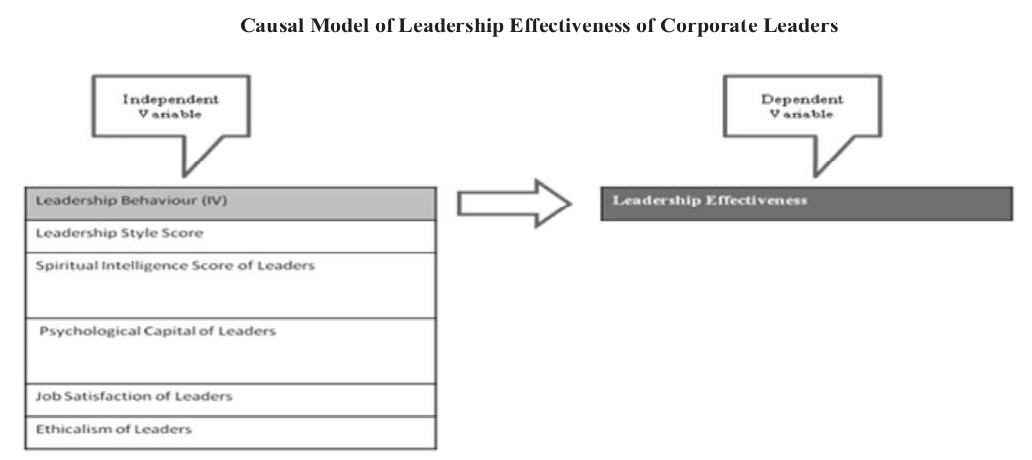
The objective of the study is to determine the relationship between various leadership behaviors practices (leadership style, spiritual intelligence, psychological capital, job satisfaction, perceived leaders’ ethicalism from subordinate’s view point) and self-perceived leadership effectiveness of transformational, transactional and laissez-faire corporate leaders of Kolkata
H1: There will be significant prediction of self-perceived leadership effectiveness of transformational corporate leaders in Kolkata by their transformational leadership style score, spiritual intelligence level, psychological capital score, and perceived ethicalism of leaders (from subordinate’s viewpoint) and their job satisfaction.
H2: There will be significant prediction of self-perceived leadership effectiveness of transactional corporate leaders in Kolkata by their transactional leadership style score, spiritual intelligence level, psychological capital score, and perceived ethicalism of leaders and by their job satisfaction.
H3: There will be significant prediction of leadership effectiveness of laissez-faire corporate leaders by their laissez-faire style leadership score, spiritual intelligence level, psychological capital score, and perceived ethicalism of leaders and by their job satisfaction.
In this study, corporate leaders who are decision makers in organizations in Kolkata are a well-defined group of individuals which can be considered as a population.
The study uses a sample which consists of 481 corporate leaders in Kolkata from various organizations such as Normura Research Institute, Financial Technologies India Pvt Ltd, Infinity Infotech Parks Ltd, Jyoti Motors Bengal Pvt Ltd, SMS India, IRS-ISSPL, Artintel Systems Laboratories Pvt. Ltd, Alumnus Software Limited, ARB Software India (P) Ltd, Atlas Software Technologies (India) Pvt. Ltd, Acclaris Business Solutions Pvt. Ltd, AMB Computer Integrated Engineering P. Ltd, AIG Systems Solutions Pvt. Ltd, BRI Technologies Pvt. Ltd, etc in Kolkata (North, West, South, and East) by applying probability sampling method (simple random sampling technique). Among 481 leaders, 273 are categorized as transformational, 164 are transactional and 44 are laissez-faire leaders by applying MLQ form 6S.
This self-assessment scale (having Cronbach’s Alpha 0.85) gives the opportunity for assessing the perceived ability to perform the tasks required of a leader from their own view point.
The short form (Bass & Avolio, 1992) is a self-report inventory (having Cronchbach’s Alpha 0.833) which is completed by the leader themselves, indicates a high level of internal consistency for the scale.
SISRI 24 designed by D. King (having cronbach’s alpha 0.95) measures various behaviors, thought processes, and mental characteristics and its split-half reliability value is 0.94.
PCQ developed by Luthans, Youssef & Avolio is a six point scale which describes how a leader may think about him /her. Internal consistency for the PCQ-24 on the four samples reported in Luthans, Avolio, Avey and Norman (2007) ranges from 0.72 to 0.80 for hope, 0.66 to 0.72 for resilience, 0.75 to 0.85 for self-efficacy and 0.69 to 0.79 for optimism.
The MSQ is designed to measure an employee’s satisfaction with their particular job by asking questions to them using a 5- point rating scale and it measures intrinsic and extrinsic measures of job satisfaction which is a standardized reliable scale.
PLIS measures a follower’s perceptions of his/her leader’s ethical integrity which shows high internal consistency (cronbach’s alpha >0.97) and expected patterns of correlation with other variables.
The data collection is undertaken in Kolkata from January to May 2018 by administering 6 questionnaires on 481 respondents representing the corporate leaders of Kolkata.
Data Analysis is done in terms of descriptive statistics (mean, SD) and the relationship between the dependent and independent variable are established by applying multiple linear regression analysis for continuous scores with the help of SPSS package 23.
|
|
N |
Minimum |
Maximum |
Mean |
Std. Deviation |
|
Transformational Leadership Score |
273 |
7.0 |
10.5 |
9.032 |
1.0720 |
|
Spiritual Intelligence Score |
273 |
34.0 |
95.0 |
73.502 |
18.9425 |
|
Job Satisfaction Score |
273 |
32.0 |
89.0 |
59.996 |
18.8302 |
|
Perceived Leader's Integrity scale |
273 |
30.0 |
48.0 |
34.476 |
6.4915 |
|
Job Satisfaction score |
273 |
44.0 |
84.0 |
68.407 |
9.6817 |
|
Valid N (listwise) |
273 |
|
|
|
|
|
|
N |
Minimum |
Maximum |
Mean |
Std. Deviation |
|
Transactional Leadership Score |
164 |
7.0 |
9.5 |
8.866 |
.3998 |
|
Spiritual Intelligence Score |
164 |
33.0 |
81.0 |
47.622 |
7.1832 |
|
Job Satisfaction score |
164 |
43.0 |
83.0 |
58.512 |
8.2703 |
|
Perceived Leader's Integrity scale |
164 |
30.0 |
50.0 |
44.512 |
5.9974 |
|
Leadership Effectiveness Score(Self Assessment Scale) |
164 |
28.0 |
94.0 |
42.927 |
13.8642 |
|
Psychological Capital score) |
164 |
32.0 |
132.0 |
77.530 |
28.3212 |
|
Valid N (listwise) |
164 |
|
|
|
|
|
|
N |
Minimum |
Maximum |
Mean |
Std. Deviation |
|
Laissez faire Leadership style Score |
44 |
7.0 |
9.5 |
8.670 |
.5386 |
|
Spiritual Intelligence Score |
44 |
37.0 |
70.0 |
55.455 |
7.8842 |
|
Job Satisfaction score |
44 |
43.0 |
74.0 |
59.523 |
7.9226 |
|
Perceived Leader's Integrity scale |
44 |
30.0 |
48.0 |
42.045 |
6.6785 |
|
Psychological Capital score) |
44 |
40.0 |
126.0 |
81.295 |
26.0684 |
|
Valid N (listwise) |
44 |
|
|
|
|
The mean of leadership effectiveness for transformational leaders is 69.392 with SD20.51, the mean score of transformational leadership style score is 9.03 with SD 1.072, the mean of their spiritual intelligence is 73.50 with SD 18.83, mean of job satisfaction score is 68.40 with SD 9.68, the mean of leader’s ethicalism is 34.476 with SD 6.49, the mean of psychological capital is 94.700 with SD 33.05 for transformational corporate leaders (see Table 1). The mean of Leadership effectiveness score is 42.927 with SD 13.86, the mean of transactional leadershipstyle score is 8.866 with SD 0.3998, the mean of spiritual intelligence score is 47.622 with SD 7.18, the mean of job satisfaction score is 58.512 with SD 8.27, the mean of psychological capital score is 77.53 with SD 28.32, the mean of perceived leader’s ethicalism score is 44.512 with SD 5.99 for transactional corporate leaders (see Table 2). The mean of laissez-faire leadership style score 8.67 with SD 0.538, the mean of spiritual intelligence score is 55.45 with SD 7.88, the mean of job satisfaction is 59.523 with SD 7.92, the mean of psychological capital score is 81.29 with SD 26.06, the mean of leader’s ethicalism is 42.045 with SD 6.678 for laissez faire corporate leaders (see Table 3).
Referring to the causal model of leadership effectiveness, the dependent variable and 5 independent variables are measured in continuous scale and the factors are approximately normally distributed , though for large samples (>200), normality assumptions are not required. None of the variables (see Table 6, 9, 12) has VIF not greater than 10, hence it indicates no severe multicollinearity and moreover the value of the Durbin-Watson test (see Table 4, 7, 10) is approximately 2, which means no auto-correlation is present.
|
Model |
R |
R Square |
Adjusted R Square |
Std. Error of the Estimate |
Change Statistics |
Durbin-Watson |
||||
|
R Square Change |
F Change |
df1 |
df2 |
Sig. F Change |
||||||
|
1 |
.853a |
.728 |
.723 |
10.7949 |
.728 |
142.986 |
5 |
267 |
.000 |
1.333 |
a. Predictors: (Constant), Zscore:  Job Satisfaction score, Zscore:  Psychological Capital score), Zscore:  Transformational Leadership Score, Zscore:  Perceived Leader's Integrity scale, Zscore:  Spiritual Intelligence Score
b. Dependent Variable: Leadership Effectiveness Score(Self Assessment Scale)
|
Model |
Sum of Squares |
df |
Mean Square |
F |
Sig. |
||||||
|
Regression |
83309.858 |
5 |
16661.972 |
142.986 |
.000b |
|
|||||
|
Residual |
31113.204 |
267 |
116.529 |
|
|
|
|||||
|
Total |
114423.062 |
272 |
|
|
|
|
|||||
a. Dependent Variable: Leadership Effectiveness Score(Self Assessment Scale)
b. Predictors: (Constant), Zscore:  Job Satisfaction score, Zscore:  Psychological Capital score), Zscore:  Transformational Leadership Score, Zscore:  Perceived Leader's Integrity scale, Zscore:  Spiritual Intelligence Score
|
Model |
Unstandardized Coefficients |
Standardized Coefficients |
t |
Sig. |
Collinearity Statistics |
|||
|
B |
Std. Error |
Beta |
Tolerance |
VIF |
||||
|
1 |
(Constant) |
69.392 |
.653 |
|
106.212 |
.000 |
|
|
|
Zscore: Transformational Leadership Score |
3.217 |
.890 |
.157 |
3.614 |
.000 |
.541 |
1.849 |
|
|
Zscore: Spiritual Intelligence Score |
4.897 |
1.128 |
.239 |
4.339 |
.000 |
.336 |
2.972 |
|
|
Zscore: Perceived Leader's Integrity scale |
-7.179 |
1.109 |
-.350 |
-6.476 |
.000 |
.349 |
2.869 |
|
|
Zscore: Psychological Capital score |
5.386 |
.947 |
.263 |
5.689 |
.000 |
.478 |
2.093 |
|
|
Zscore: Job Satisfaction score |
-1.202 |
.695 |
-.059 |
-1.731 |
.085 |
.888 |
1.127 |
|
a. Dependent Variable: Leadership Effectiveness Score(Self Assessment Scale)
|
Model |
R |
R Square |
Adjusted R Square |
Std. Error of the Estimate |
Change Statistics |
Durbin-Watson |
||||
|
R Square Change |
F Change |
df1 |
df2 |
Sig. F Change |
||||||
|
1 |
.702a |
.493 |
.477 |
10.0250 |
.493 |
30.750 |
5 |
158 |
.000 |
1.753 |
a. Predictors: (Constant), Zscore: Psychological Capital score), Zscore: Transactional Leadership Score, Zscore: Spiritual Intelligence Score, Zscore: Job Satisfaction score, Zscore: Perceived Leader's Integrity scale b. Dependent Variable: Leadership Effectiveness Score(Self Assessment Scale)
|
Model |
Sum of Squares |
df |
Mean Square |
F |
Sig. |
|
|
1 |
Regression |
15452.114 |
5 |
3090.423 |
30.750 |
.000b |
|
Residual |
15879.008 |
158 |
100.500 |
|
|
|
|
Total |
31331.122 |
163 |
|
|
|
|
a. Dependent Variable: Leadership Effectiveness Score(Self Assessment Scale) b. Predictors: (Constant), Zscore: Psychological Capital score), Zscore: Transactional Leadership Score, Zscore: Spiritual Intelligence Score, Zscore: Job Satisfaction score, Zscore: Perceived Leader's Integrity scale
|
Model |
Unstandardized Coefficients |
Standardized Coefficients |
t |
Sig. |
Correlations |
Collinearity Statistics |
||||||||||||||
|
B |
Std. Error |
Beta |
Zero-order |
Partial |
Part |
Tolerance |
VIF |
|||||||||||||
|
(Constant) |
42.927 |
.783 |
|
54.836 |
.000 |
|
|
|
|
|
||||||||||
|
Zscore: Transactional Leadership Score |
.169 |
.792 |
.012 |
.214 |
.831 |
-.008 |
.017 |
.012 |
.984 |
1.016 |
||||||||||
|
Zscore: Spiritual Intelligence Score |
-1.179 |
.799 |
-.085 |
-1.476 |
.142 |
.015 |
-.117 |
-.084 |
.966 |
1.036 |
||||||||||
|
Zscore: Job Satisfaction score |
1.381 |
.795 |
.100 |
1.738 |
.084 |
.033 |
.137 |
.098 |
.976 |
1.024 |
||||||||||
|
Zscore: Perceived Leader's Integrity scale |
-9.277 |
.801 |
-.669 |
-11.589 |
.000 |
-.676 |
-.678 |
-.656 |
.962 |
1.039 |
||||||||||
|
Zscore: Psychological Capital score) |
2.261 |
.806 |
.163 |
2.803 |
.006 |
.240 |
.218 |
.159 |
.948 |
1.055 |
||||||||||
. Dependent Variable: Leadership Effectiveness Score(Self Assessment Scale)
|
Model |
R |
R Square |
Adjusted R Square |
Std. Error of the Estimate |
Change Statistics |
Durbin-Watson |
||||
|
R Square Change |
F Change |
df1 |
df2 |
Sig. F Change |
||||||
|
1 |
.647a |
.418 |
.342 |
9.2519 |
.418 |
5.461 |
5 |
38 |
.001 |
1.342 |
a. Predictors: (Constant), Zscore: Psychological Capital score), Zscore: Laissezfaire Leadership style Score, Zscore: Job Satisfaction score, Zscore: Spiritual Intelligence Score, Zscore: Perceived Leader's Integrity scale b. Dependent Variable: Leadership Effectiveness Score(Self Assessment Scale)
|
Model |
Sum of Squares |
df |
Mean Square |
F |
Sig. |
|
|
1 |
Regression |
2337.165 |
5 |
467.433 |
5.461 |
.001b |
|
Residual |
3252.722 |
38 |
85.598 |
|
|
|
|
Total |
5589.886 |
43 |
|
|
|
|
a. Dependent Variable: Leadership Effectiveness Score(Self Assessment Scale) b. Predictors: (Constant), Zscore: Psychological Capital score), Zscore: Laissezfaire Leadership style Score, Zscore: Job Satisfaction score, Zscore: Spiritual Intelligence Score, Zscore: Perceived Leader's Integrity scale
|
Model |
Unstandardized Coefficients |
Standardized Coefficients |
t |
Sig. |
Correlations |
Collinearity Statistics |
|||||
|
B |
Std. Error |
Beta |
Zero-order |
Partial |
Part |
Tolerance |
VIF |
||||
|
1 |
(Constant) |
27.861 |
29.385 |
|
.948 |
.349 |
|
|
|
|
|
|
Laissezfaire Leadership style Score |
1.835 |
2.808 |
.087 |
.654 |
.517 |
-.137 |
.105 |
.081 |
.871 |
1.149 |
|
|
Spiritual Intelligence Score |
.435 |
.185 |
.301 |
2.351 |
.024 |
.411 |
.356 |
.291 |
.935 |
1.069 |
|
|
Job Satisfaction score |
.156 |
.179 |
.108 |
.867 |
.392 |
.089 |
.139 |
.107 |
.985 |
1.015 |
|
|
Perceived Leader's Integrity scale |
-.886 |
.231 |
-.519 |
-3.836 |
.000 |
-.561 |
-.528 |
-.475 |
.836 |
1.196 |
|
|
Psychological Capital score) |
.030 |
.055 |
.069 |
.552 |
.585 |
.080 |
.089 |
.068 |
.979 |
1.022 |
|
a. Dependent Variable: Leadership Effectiveness Score(Self Assessment Scale)
Referring to Table 6, four predictive variables (Transformational leadership style, spiritual intelligence of leaders, psychological capital, perceived ethicalism of leaders) are significant in predicting their leadership effectiveness because they have their p-values(0.000, 0.000, 0.000, 0.000 respectively) are smaller than 0.05, but p-value of job satisfaction (0.085) is greater than 0.05 for transformational leaders. In this case the coefficient of determination (R2) is 72.8% (see Table 4) which means that independent variables explain 72.8% of the variability of dependent variable (leadership effectiveness). The ANOVA table (see Table 5) shows that the independent variables statistically significantly predict the dependent variable, F (5, 267) = 142.986, p < .0005 (i.e., the regression model is a good fit of the data). Thus, in case of corporate transformational leaders, transformational leadership style, their spiritual intelligence score, psychological capital score and perceived leaders’ ethicalism are significant and their job satisfaction are insignificant in predicting their leadership effectiveness in Kolkata. Hence, H1 is partially accepted. Referring to Table 9, two predictive variables (psychological capital, ethicalism of leaders) are significant in predicting their leadership effectiveness because their p-values (0.006 and 0.000 respectively) are smaller than 0.05 for transactional corporate leaders, but three predictive variables (transactional leadership style score, job satisfaction and spiritual intelligence score) are insignificant in predicting their leadership effectiveness because they have their p-values (0.831, 0.084 and 0.142 respectively) are greater than 0.05. In this case the coefficient of determination (R2) is 49.3% (see Table 7) which means that independent variables explain 49.3% of the variability of dependent variable (leadership effectiveness).The ANOVA table (see Table 8) shows that the independent variables statistically predict the dependent variable, F (5, 158) = 30.750, p < .0005. Thus, in case of corporate transactional leaders, psychological capital and perceived leaders’ ethicalism are significant and their transactional leadership style, their spiritual intelligence score and job satisfaction are insignificant in predicting their leadership effectiveness in Kolkata. Hence, H2 is partially accepted. For laissez-faire leaders, laissez-faire leadership style score(see Table 12), job satisfaction and psychological capital score are insignificant in predicting leadership effectiveness because their p-values(0.517, 0.392, 0.585) are greater than 0.05 and their spiritual intelligence score and perceived leaders’ ethicalism are significant predictors in predicting their leadership effectiveness as their p- values(0.024,0.000) are smaller than 0.05. In this case the coefficient of determination (R2) is 41.8% (see Table 10) which means that independent variables explain 41.8% of the variability of the dependent variable (leadership effectiveness) for laissez faire leaders. The ANOVA table (Table 11) shows that the independent variables statistically predict the dependent variable, F (5, 38) =5.461, p < .0005. Hence, H3 is partially accepted. Thus, only spiritual intelligence score and perceived leader’s ethicalism are significant predictors and laissez-faire leadership style, psychological capital and job satisfaction are insignificant predictors in determining leadership effectiveness of laissez-faire corporate leaders in Kolkata.
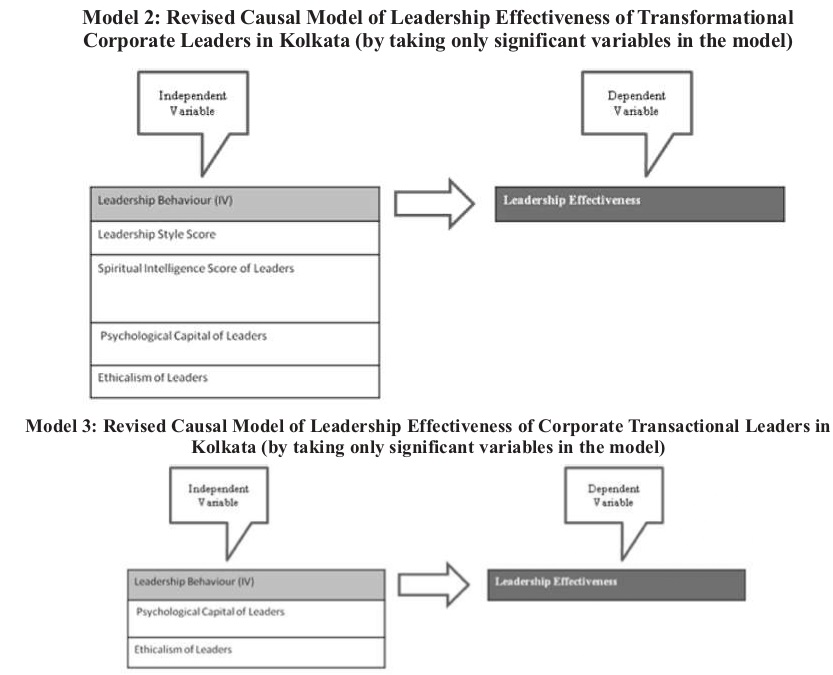
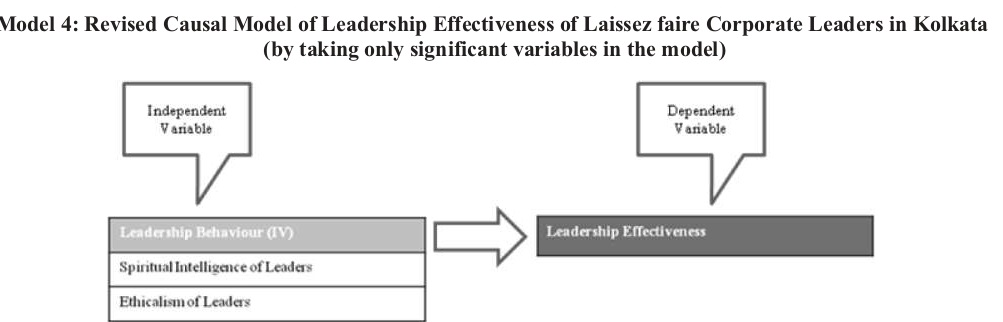
H4: There will be significant prediction of self-perceived leadership effectiveness of transformational corporate leaders in Kolkata by their transformational leadership style score, spiritual intelligence level, psychological capital score, and perceived ethicalism of leaders.

H5: There will be significant prediction of self-perceived leadership effectiveness of transactional corporate leaders in Kolkata by their psychological capital score and their perceived ethicalism (from subordinate’s viewpoint).
H6: There will be significant prediction of self-perceived leadership effectiveness of laissez-faire corporate leaders in Kolkata by their spiritual intelligence score and perceived ethicalism (from subordinate’s viewpoint).
|
Model |
R |
R Square |
Adjusted R Square |
Std. Error of the Estimate |
Change Statistics |
Durbin-Watson |
||||
|
R Square Change |
F Change |
df1 |
df2 |
Sig. F Change |
||||||
|
1 |
.851a |
.725 |
.721 |
10.8350 |
.725 |
176.668 |
4 |
268 |
.000 |
1.330 |
a. Predictors: (Constant), Zscore: Psychological Capital score), Zscore: Transformational Leadership Score, Zscore: Perceived Leader's Integrity scale, Zscore: Spiritual Intelligence Score b. Dependent Variable: Leadership Effectiveness Score(Self Assessment Scale)
|
Model |
Sum of Squares |
df |
Mean Square |
F |
Sig. |
|||||
|
Regression |
82960.850 |
4 |
20740.212 |
176.668 |
.000b |
|
||||
|
Residual |
31462.212 |
268 |
117.396 |
|
|
|
||||
|
Total |
114423.062 |
272 |
|
|
|
|
||||
a. Dependent Variable: Leadership Effectiveness Score(Self Assessment Scale) b. Predictors: (Constant), Zscore: Psychological Capital score), Zscore: Transformational Leadership Score, Zscore: Perceived Leader's Integrity scale, Zscore: Spiritual Intelligence Score
|
Model |
Unstandardized Coefficients |
Standardized Coefficients |
t |
Sig. |
95.0% Confidence Interval for B |
Correlations |
Collinearity Statistics |
||||||
|
B |
Std. Error |
Beta |
Lower Bound |
Upper Bound |
Zero-order |
Partial |
Part |
Tolerance |
VIF |
||||
|
1 |
(Constant) |
69.392 |
.656 |
|
105.819 |
.000 |
68.101 |
70.683 |
|
|
|
|
|
|
Zscore: Transformational Leadership Score |
2.976 |
.882 |
.145 |
3.373 |
.001 |
1.239 |
4.713 |
.638 |
.202 |
.108 |
.554 |
1.804 |
|
|
Zscore: Spiritual Intelligence Score |
4.661 |
1.124 |
.227 |
4.145 |
.000 |
2.447 |
6.874 |
.753 |
.245 |
.133 |
.341 |
2.929 |
|
|
Zscore: Perceived Leader's Integrity scale |
-7.119 |
1.112 |
-.347 |
-6.401 |
.000 |
-9.309 |
-4.929 |
-.775 |
-.364 |
-.205 |
.349 |
2.866 |
|
|
Zscore: Psychological Capital score |
5.487 |
.949 |
.268 |
5.785 |
.000 |
3.620 |
7.355 |
.719 |
.333 |
.185 |
.480 |
2.085 |
|
a. Dependent Variable: Leadership Effectiveness Score(Self Assessment Scale)
|
Model |
R |
R Square |
Adjusted R Square |
Std. Error of the Estimate |
Durbin-Watson |
|
1 |
.690a |
.476 |
.470 |
10.0957 |
1.658 |
a. Predictors: (Constant), Zscore: Perceived Leader's Integrity scale, Zscore: Psychological Capital score) b. Dependent Variable: Leadership Effectiveness Score(Self Assessment Scale)
|
Model |
Sum of Squares |
df |
Mean Square |
F |
Sig. |
|
|
1 |
Regression |
14921.383 |
2 |
7460.691 |
73.199 |
.000b |
|
Residual |
16409.739 |
161 |
101.924 |
|
|
|
|
Total |
31331.122 |
163 |
|
|
|
|
a. Dependent Variable: Leadership Effectiveness Score(Self Assessment Scale) a. Predictors: (Constant), Zscore: Perceived Leader's Integrity scale, Zscore: Psychological Capital score)
|
Model |
Unstandardized Coefficients |
Standardized Coefficients |
t |
Sig. |
|||||||
|
B |
Std. Error |
Beta |
|||||||||
|
(Constant) |
42.927 |
.788 |
|
54.452 |
.000 |
|
|||||
|
Zscore: Psychological Capital score |
1.963 |
.800 |
.142 |
2.454 |
.015 |
|
|||||
|
Zscore: Perceived Leader's Integrity scale |
-9.074 |
.800 |
-.654 |
-11.345 |
.000 |
|
|||||
a. Dependent Variable: Leadership Effectiveness Score(Self Assessment Scale)
|
Model |
R |
R Square |
Adjusted R Square |
Std. Error of the Estimate |
Change Statistics |
Durbin-Watson |
||||
|
R Square Change |
F Change |
df1 |
df2 |
Sig. F Change |
||||||
|
1 |
.630a |
.397 |
.367 |
9.0681 |
.397 |
13.489 |
2 |
41 |
.000 |
1.343 |
a. Predictors: (Constant), Zscore: Perceived Leader's Integrity scale, Zscore: Spiritual Intelligence Score b. Dependent Variable: Leadership Effectiveness Score(Self Assessment Scale)
|
Model |
Sum of Squares |
df |
Mean Square |
F |
Sig. |
|
|
1 |
Regression |
2218.443 |
2 |
1109.222 |
13.489 |
.000b |
|
Residual |
3371.443 |
41 |
82.230 |
|
|
|
|
Total |
5589.886 |
43 |
|
|
|
|
a. Dependent Variable: Leadership Effectiveness Score(Self Assessment Scale) b. Predictors: (Constant), Zscore: Perceived Leader's Integrity scale, Zscore: Spiritual Intelligence Score
|
Model |
Unstandardized Coefficients |
Standardized Coefficients |
t |
Sig. |
||
|
B |
Std. Error |
Beta |
||||
|
1 |
(Constant) |
42.341 |
1.367 |
|
30.972 |
.000 |
|
Zscore: Spiritual Intelligence Score |
3.364 |
1.423 |
.295 |
2.364 |
.023 |
|
|
Zscore: Perceived Leader's Integrity scale |
-5.601 |
1.423 |
-.491 |
-3.935 |
.000 |
|
a. Dependent Variable: Leadership Effectiveness Score(Self Assessment Scale)
Four predictive variables (Transformational leadership style, spiritual intelligence of leaders, psychological capital, perceived ethicalism of leaders) are significant in predicting their leadership effectiveness because they have their p-values (0.001, 0.000, 0.000, 0.000 respectively) are smaller than 0.05 for transformational corporate leaders in Kolkata (see table 15). In this case the coefficient of determination (R2) is 72.5% (see Table 13) which means that independent variables explain 72.5% of the variability of dependent variable. The ANOVA table (Table14) shows that the independent variables statistically significantly predict the dependent variable, F (4, 268) = 176.668, p <.0005 (i.e., the regression model is a good fit of the data). Thus, in case of corporate transformational leaders, transformational leadership style, their spiritual intelligence score, psychological capital score and perceived leaders’ integrity scale are significant in predicting their leadership effectiveness in Kolkata. Hence, H4 is accepted. Therefore, the relevant regression equation for transformational corporate leader is: Leadership Effectiveness of Transformational Corporate Leaders =69.392+ 2.976* Transformational Leadership style Score +4.661* Spiritual Intelligence Score + (-7.119)* Leader’s Ethicalism + 5.487* Psychological Capital Score of Leaders Two predictive variables (psychological capital, perceived ethicalism of leaders) are significant in predicting their leadership effectiveness of transactional corporate leaders in Kolkata because they have their p-values (0.015, 0.000 respectively) are smaller than 0.05 (see table 18). In this case the coefficient of determination (R2) is 47.6% (see Table 16) which means that independent variables explain 47.6% of the variability of dependent variable (leadership effectiveness). The ANOVA table (see Table 17) shows that the independent variables statistically significantly predict the dependent variable, F (2,161) = 73.199, p <.0005 (i.e., the regression model is a moderate fit of the data). Thus, in case of corporate transactional leaders, their psychological capital score and perceived leaders’ ethicalism are significant in predicting their leadership effectiveness in Kolkata. Hence, H5 is accepted. Therefore, the relevant regression equation for transactional corporate leader is: Leadership Effectiveness of Transactional Corporate Leaders =42.927+ 1.963* Psychological Capital score of Leaders+ (-9.074)* Ethicalism of Leaders Referring to Table 21, spiritual intelligence score and perceived leaders’ ethicalism are significant predictors in determining their leadership effectiveness as their p- values(0.023, 0.000) are smaller than 0.05. Again, In this case the coefficient of determination (R2) is 36.7% (see Table 19) which means that independent variables explain 36.7 % of the variability of the dependent variable (leadership effectiveness).The ANOVA table (see Table 20) shows that the independent variables statistically significantly predict the dependent variable, F (2, 41) = 13.489 , p < .0005. Thus, only spiritual intelligence score and perceived leader’s ethicalism are significant predictors in determining leadership effectiveness of laissez-faire corporate leaders in Kolkata. Hence, H6 is accepted. Therefore, the relevant regression equation for laissez-faire corporate leader is: Leadership Effectiveness of Laissez-faire Corporate Leaders =42.341+3.364* Spiritual Intelligence score + (-5.601)* Ethicalism of Leaders
In today's VUCA world, transformational corporate leaders motivate employees to create change that will shape the future success of the company through a strong sense of corporate culture, employee ownership and independence in the workplace. Spiritually sensitive corporate leaders demonstrate respect to all persons and their roles. Corporate leaders with higher psychological capital in the workplace also are in a better position to support their employees to respond effectively to the pressure, chronic demands, and to carry out responsibilities of authority. With each decision, a successful corporate leader must be transparent and encourage feedback from his/her team which will help the workers to feel more confident and sharing their ideas or concerns. Corporate leadership should be implemented by every person in a leadership position which fosters an environment of trust and respect with workers and executives. As job satisfaction is defined as the level of contentment a person receives by performing his/her job, thus, transformational leaders face several difficulties to tackle with the challenging situation where decisions are reduced to a tangled mesh of reaction and counter-reaction. It’s becoming nearly impossible to plan for investment, development, and growth of the organization as it becomes increasingly uncertain where the route is heading. Problems and their repercussions are more multi-layered making it impossible to get an overview of how things are related. In today’s world it’s rare for things to be completely clear or precisely determinable. Thus, transformational corporate leaders lose their job satisfaction at work and thus, in case of corporate transformational leaders, transformational leadership style, their spiritual intelligence level, psychological capital and perceived leader’s ethicalism (from follower’s view point) are significant but their job satisfaction is insignificant in predicting their leadership effectiveness in Kolkata, India in VUCA world. As this research shows in VUCA world, transactional and laissez-faire leadership style both are insignificant in predicting their leadership effectiveness. Using transactional leadership style, leaders generally promote compliance by followers through both rewards and punishments and are able to keep followers motivated for the short-term, thus it becomes insignificant in predicting leadership effectiveness. On the other hand, due to lack of role awareness, poor involvement with the group, low accountability, laissez faire leaders might even take advantage of this style as a way to avoid personal responsibility for the group's failures when the leader can blame members of the team for not completing tasks or living up to expectations. Thus, laissez-faire leadership style is also an insignificant predictor of leadership effectiveness for corporate leaders in Kolkata. Transactional leaders are self- confident and focus on specific tasks and use rewards and punishments to motivate followers. Since Psychological Capital is strongly linked to increased wellbeing, work and life satisfaction when all four areas (hope, efficacy, resilience, optimism) are taken into consideration. More hopeful employees show higher job performance and produce better quality solutions to problems arising at work. Norman (2006) found that a leader’s level of Psy Cap impacts followers’ trust in the leader and thus Psy Cap is significantly associated with transparency, trust in management, overall leader rating and provide strong support for the positive outcomes that PsyCap generates in followers, leaders, and organizations. Thus in this study, Psy Cap and leader’s ethicalism from followers view point are significant predictors of leadership effectiveness of transactional leaders in Kolkata, India in VUCA world. Again, laissez-faire leaders provide freedom for followers to make decisions and group members are expected to resolve the problems on their own. Spirituality is manifested in the workplace through spiritual values, personal development of one's full potential and direct linkages to values such as ethics, hope, honesty, and forgiveness. Laissez-faire represented an absence of transaction of sorts with respect to the leadership in which the leaders avoided making decisions, abdicated responsibility, and did not use authority. Thus, for laissez-faire leaders, spiritual intelligence and leader’s ethicalilism become significant predictors in determining their leadership effectiveness in Kolkata, India in VUCA world.
This study considers only 481 corporate leaders in Kolkata, but the number is not very satisfactory to conclude the relationship between leadership behavior with leadership effectiveness of corporate leaders in Kolkata. The relationship examined in the study is based on self-perceptions of corporate leaders which is prone to common method variance (Doty & Glick, 1998) in spite of being representative of organization and sample. Finally, the present research is cross-sectional in nature that means the data is collected for one time period. For future work, sophisticated tools and techniques can be used which will refine our technique in order to get more valuable and accurate result that would be useful for corporate leaders to improve their effectiveness in VUCA world.
Ababneh. M. A. (2013). Leadership Style of Managers in Five-Star Hotels and its Relationship with Employee’s Job Satisfaction. International Journal of Management & Business studies. 3, (2), 93-98.
Alam, S. (2014). The Relationship between Spiritual Intelligence and Transformational Leadership in Sports Managers. Bulletin of Environment, Pharmacology and Life Sciences, 3(IV), 1-5.
Bass, B. M. (1990). Bass and Stogdill’s handbook of leadership. New York: Free E-Leader Milan 2014 Press.
Bass, B. M., & Avolio, B.J. (1994). Improving organizational effectiveness through transformational leadership. Thousand Oaks, CA: Sage Publications.
 Bass, B. M. (1998a). The ethics of transformational leadership. In J. Ciulla (Ed.), Ethics: The heart of leadership (pp. 169–192). Westport, CT: Praeger.
Bass, B. M. (1998b). Transformational leadership: Industrial, military, and educational impact. Mahwah, NJ: Lawrence Erlbaum Associates, Inc.
Bass, B. M., & Steidlmeier, P. (1999). Ethics, character, and authentic transformational leadership behavior. Leadership Quarterly, 10, 181–217.
Belonio, R. J. (2012). The Effect of Leadership Style on Employee Satisfaction and Performance of Bank Employees in Bangkok. 5(2). AU -GSB e -journal. 111-116
Fred Luthans, Carolyn M. Youssef, and Bruce J. Avolio (2006). Psychological Capital: Developing the Human Competitive Edge.
Clark, D. R. (2015). Leadership Self-Assessment Questionnaire. Retrieved. February 23, 2016,
Craig, S.B. & Gustafson, S.B. (1998). Perceived Leader Integrity Scale: An Instrument for Assessing Employee Perceptions of Leader Integrity. The Leadership Quarterly, 9(2), 127-145.
Doty, D. H., & Glick, W. H. (1998), Common methods bias: Does common methods variance really bias results? Organizational Research Methods, 1, 374-406.
Doty, D.H., & Glick W.H. (1998). Common method bias: Does common methods variance really bias results? Organizational Research Methods, 1, 374-406.http://www.academia.edu/4165677/
Hernández, J.G, Arias, A.D.L.A.V. Z. & Girón, V.C.G. (2012). Enhancing Leadership Integrity Effectiveness Strategy Through The Institutionalization Of An organizational Management Integrity Capacity Systems. Asian Journal of Multidimensional. 1(3), 94-130.
Leader Effectiveness Inventory ©2010 Organization Dimensions.
Luthans, F., Avolio, B. J., Avey, J. B. & Norman, SM. (2007). Positive Psychological Capital: Measurement And Relationship With Performance And Satisfaction. Personnel Psychology, 60, 541-572.
Luthans, F., Norman, S., & Hughes, L. (2006). Authentic Leadership. In R. Burke, & C. Cooper (Eds.), Inspiring Leaders (pp. 84-104). London: Routledge, Taylor & Francis.
Northouse, P. G., (2016). Leadership: Theory and practice, Thousand Oaks, California, SAGE Publications, Inc., 329-362.
Northouse, P.G. (2013). Leadership: Theory and practice. Los Angeles: Sage.

