|
V. Harshitha Moulya Research Scholar Department of Business Administration Mangalore University Mangalore |
Dr T. Mallikarjunappa Professor Department of Business Administration Mangalore University Mangalore |
The excess market return earned by investors over the risk-free rate is termed as equity premium. Mehra and Prescott (1985) found a very high equity premium of 6% for the US market, which was very puzzling for various reasons. Several theories have guided the curiosity of this puzzle attributable to the consumption behaviour pattern and habits formation of individual investors. We used aggregate ratios of firms’ dividends and earnings as a proxy for investors’ consumption behaviour to estimate the equity premium for a cross-sectional portfolio of firms using in-sample and out-sample data. We found that, though, the dividend-price and earnings-price ratios acted as best in-sample predictors of excess equity returns. The estimated risk-premium varied across the cross-section of firms.
Keywords: Equity Premium, Excess Risk-Premium, Dividend-Price, Earnings-Price, Earnings-Yield, Dividend-Yield, Firm Size, BM ratio.
The rational expectation framework proposed that the risk-averse representative agents in the general equilibrium always tried to maximise their expected value of the discounted stream of cash-flows generated through an expected utility model (Lucas, 1978). It iscriticised as it failed to account for the large return differentials in the expected stock returns over the risk-free rate in the US market documented by Mehra and Prescott (1985). They estimated a large equity premium of 6.18% and the risk-free rate of 0.8% vis-à-vis the historically observed premium of 0.35% for the US market, which was termed as the equity premium puzzle.The rationalists attributed the large equity premium to macro-economic factors viz., the deferred consumption by risk-averse investors (John Y. Campbell & Cochrane, 1999; Weil, 1989) whereas the behaviourists proposed that the behaviour of individual investors viz., theexternal habit formation (Constantinides, 1990), and the behaviour of representative agent according to the prospect theory (Benartzi & Thaler, 1995) caused anomalous equity premium. Studies by(Campbell & Cochrane, 2000; Fama & French, 1988; Welch & Goyal, 2008) used the aggregate dividends and earnings of firms as a proxy for market consumption to estimate equity premium. In our study, we used aggregate dividends ratios and earnings ratios viz., dividend-price ratio, dividend-yield ratio, earnings-price ratio and earnings-yield ratio, for estimating the excess equity returns for the Indian market using the data of the NSE listed firms. The study is different in three things, viz., - 1) we used the best-fit linear model for estimation of equity returns and adjusted for the non-linearity using a best-fit conditional-variance model, 2) portfolio-based estimation of excess equity returns, and 3) we used in-sample and out-sample estimations for the robustness of estimation models. We found that the estimated excess risk premium varied across the cross-section of firms. Both the dividend-price and earnings-price ratios estimated the in-sample equity premium; the out-sample estimations were not better failing to prove the robustness of the estimation models. This paper is structured to discuss the literature review, theoretical framework for the selection of variables and hypothesised relationship between variables in section 2; data and methodology in section 3; discussion of results in section 4; and findings and conclusion in section 5.
The equity premium is the extra risk premium earned by investors by making an investment in a portfolio of risky securities over risk- free securities. Mehra and Prescott (1985) found a large equity premium of 6-8% vis-à-vis the historically observed equity premium of 0.35% for the US market, which was puzzling. A few studies tried to explain the equity premium puzzle by proposing new theories. The rationalist theory of Weil (1989)attributed the substantial equity premium to the deferred consumption behaviour of risk-averse investors attempting to generate higher per capita consumption growth rate over the rate offered by the risk-free Treasury bills. He suggested the equity premium puzzle transformed into the risk-free rate puzzle as the risk-averse investors under Lucas (1978) framework deferred their consumption by saving more even when the risk-free rate of returns offered was meagre. Campbell and Cochrane (1999) caused anomalous equity premium. Studies by (Campbell & Cochrane, 2000; Fama & French, 1988; Welch & Goyal, 2008) used the aggregate explained that the equity premium puzzle through a consumption-based model where the aggregate consumption behaviour of representative agents perfectly correlated with the business cycle. The pro-cyclical consumption declined towards the habit during the business trough, and the counter-cyclical equity premium puzzle increased due to the cross-sectional variations in the wealth distribution of the heterogeneous representative agents. The behaviourist theory of Constantinides (1990) explained the equity premium puzzle and the risk-free rate puzzle through the model of ‘habit-formation’ of the representative agents, where risk-averse agents didn’t consider the effect the current consumption on future preferences, but their utility depended on the levels of past consumption. The model failed to explain the consumption behaviour of wealthy investors, pension funds and endowments at the aggregate market level (Benartzi & Thaler, 1995). The duo proposed that investors behaved according to the prospect theory (Kahneman & Tversky, 1979), where, the risk-averse investors demanded a higher premium for assuming a higher variability in the securities returns due to their high sensitivity to losses. Thus, the highly risk-averse investors demand higher risk-premium as compensation for undertaking investments in the highly-risky securities.
Mehra and Prescott (1985) used the real S&P index return and the estimated realinterest rate for the estimation of the equity premium. The security risk used in the estimation model was measured as a covariance of security returns with the per capita consumption, aproxy for consumption stream of investors under the rational utility framework. Welch (2000) surveyed finance professionals regarding estimation of the equity premium and found that there was neither a proper explanation for high values of equity premium nor any consensus on how to forecast equity premium. Thus there is an overlap of techniques used for estimation of expected stock returns and the excess equity returns, i.e. the equity premium. The seminal literature on the estimation of stock returns viz., the Capital Asset Pricing Model (CAPM) (Black, 1972; Lintner, 1965; Sharpe, 1964)established a linear relationship between the expected returns on securities and the market risk, where, the market risk is measured by beta in the general equilibrium model. The CAPM proposed that beta alone explained the expected stock returns given that markets are efficient. If the efficient markets hypothesis were to hold, the stocks were to be priced rationally, then the systemic differences in stock returns are attributed to the differences in risk. The market capitalisation of firm (Banz, 1981), the earnings-price (EP) ratio (Basu, 1983; Chan, Hamao, & Lakonishok, 1991) and the book equity to market equity (BM) ratio (Chan, Jegadeesh, & Lakonishok, 1995; Fama & French, 1992, 1993, 1996, 2006, 2012) along with the market beta significantly contributed for explaining the cross-sectional variation of expected stock returns. Campbell and Cochrane(2000) used the consumption-based model (Campbell & Cochrane, 1999) and the CAPM (Black, 1972; Lintner, 1965; Sharpe, 1964) to explain the time-varying expected returns using the dividend-price ratio as a proxy for market consumption. They found that, though, both the models estimated conditional asset returns, however, the portfolio-based models better approximated the unconditional asset returns. Campbell and Cochrane (1999, 2000) observed that changes in dividend explained more than half of the variation in stock returns and, variations in the aggregate dividend-price ratio is due to variations in aggregated expected excess returns. Berk (1995) found a strong correlation between expected stock return and dividend-yield, along with other non-systemic firm variables, failed the CAPM to account for cross-sectional differences in expected stock returns. Fama and French (2002) suggested that any variable that is co-integrated with stock price can be used to estimate expected stock return, but the ratios should be mean-reverting and stationary. They observed multicollinearity between the dividend-price ratio and earnings-price ratio. Their study found that estimation of expected returns using the firm’s fundamentals outperformed any other estimation on the ground of lower standard error and Sharpe ratio. Dimson, Marsh, and Staunton (2008)decomposed the equity risk premium into three components viz., the level of dividends, the growth in dividends and the effects of stock prices on dividend-price ratio. Fama and French(1988) used dividend yields for the estimation of expected stock returns. Fama and French(2002), Welch and Goyal(2008) used aggregate earnings and dividends ratios (dividend-price, dividend-yield, earnings-price, and earnings-yield ratios) for estimation of excess risk-premium; the theoretical arguments on asset pricing proposed that an average estimated stock return is the sum of the average dividend yield and the average rate of capital gain. These studies have predominantly used linear estimation technique for the expected equity premium. The dividend-yield ratio and the dividend-price ratio were found to be the dominant predictors of future returns using artificial neural networks (Wong, Hassan, & Feroz, 2007; Welch & Goyal, 2008). Welch and Goyal(2008) accounted for the non-linearity in the predictor variables viz., dividends ratios. Claus and Thomas (2001) and Gebhardt, Hvidkjaer, and Swaminathan (2005)used valuation models involving dividends and earnings ratios to estimate unconditional expected returns. Siegel (1992) and Siegel and Thaler (1997) acknowledged that the standard asset pricing models could not explain the higher equity premium. Damodaran (2009, 2012) noted that the variation in expected equity premium vis-à-vis the actual historical equity premium of about 3% to 12% is due to the choice of different estimation periods, differences in risk-free rates and market indices, and differences in the way returns are averaged over time. The literature analysis identifies that there is an overlap of estimation techniques used for expected stock returns, and equity premium, and no proper consensus on the estimation technique for equity premium. Previous studies have predominantly used linear estimation techniques and valuation models for estimation of conditional and unconditional expected returns. It is found that dividends ratios acted as powerful predictors of expected stock returns. However, the time-dependent, non-linear and non-stationary dividends ratios contradict the proposition of stationary and mean-reverting predictor variables resulting in sparse estimation. Thus there is a strong need for studies to explore robust estimation techniques for equity premium. In our study, we perform a linear estimation of equity premium after adjusting for the time-dependent characteristics of the predictor variables by using the best-fit conditional and unconditional estimation models. We test for the robustness of the models by testing their out-sample performance. We use the portfolio-based estimation of equity premium for cross-sectional portfolios formed based on EP ratio, Firm size and the BM ratio rather than using firm-level data.
We have used the monthly data of NSE listed firms, i.e. NSE 500 firms in the study. The period considered in the study is between 2004 and 2015. We formed different cross-sectional portfolios for the estimation of the equity premium.
The NSE 500 firms have been categorised into different cross-sectional portfolios, sorted based on EP ratio, BM ratio and the market capitalisation of the firms. The annual averages of the ratios were cumulated and ranked in descending order. The top 10 percent and the bottom 10 percent of firms under each category are considered for the analysis. Thus, we have considered six portfolios of 50 stocks each viz., EP High (top 10% EP firms), EP Low (Bottom 50 EP firms), Growth firms (top 10% BM firms), Value firms (Bottom 50 BM firms), MK High (top 50 market cap firms), and MK Low (bottom 10% market cap firms).
We collected the monthly closing prices of NSE 500 stocks, their EP ratio, market capitalisation and the BM ratio from the CMIE Prowess database. The CCIL 90 days Treasury-bill index is used as a proxy for the risk-free rate. The T-bill index data is downloaded from the CCIL website, the sister website of the NSE. The variables used for regression are explained in Table 1.
|
Notation |
Formula |
Description |
||||||||||||||||||||||||||||||||||||||||||||||||||||||||||||||||||||||||||||||||||||||||||||||||
|
Variables |
||||||||||||||||||||||||||||||||||||||||||||||||||||||||||||||||||||||||||||||||||||||||||||||||||
|
Where = stock price of an ith stock at the time ‘t’, N = No. of stocks in the portfolio |
Equal-weighted portfolio price at time ‘t.’ |
|||||||||||||||||||||||||||||||||||||||||||||||||||||||||||||||||||||||||||||||||||||||||||||||||
|
(-1) |
Lag price of the equal-weighted portfolio at time ‘t’ |
|||||||||||||||||||||||||||||||||||||||||||||||||||||||||||||||||||||||||||||||||||||||||||||||||
|
|
Where = dividends of the ith stock at the time ‘t’; |
Aggregate dividends of all the stock in the portfolio at time ‘t’ |
||||||||||||||||||||||||||||||||||||||||||||||||||||||||||||||||||||||||||||||||||||||||||||||||
|
|
Where = earnings per share of the ith stock at the time ‘t’; |
Aggregate earnings of all the stocks in the portfolio at time ‘t’ |
||||||||||||||||||||||||||||||||||||||||||||||||||||||||||||||||||||||||||||||||||||||||||||||||
|
Where, rt = risk-free rate of risk-free portfolio at time ‘t’ |
Risk-free return at time ‘t’ of the portfolio of risk-free treasury bills |
|||||||||||||||||||||||||||||||||||||||||||||||||||||||||||||||||||||||||||||||||||||||||||||||||
|
(-1) |
The risk-free rate at time ‘t-1’ ofthe portfolio of risk-free treasury bills |
|||||||||||||||||||||||||||||||||||||||||||||||||||||||||||||||||||||||||||||||||||||||||||||||||
|
|
Where pit = price of the ith stock at time t; n = no. of outstanding stocks of the ith stock; |
The market capitalisation of the equal-weighted portfolio at time ‘t’ |
||||||||||||||||||||||||||||||||||||||||||||||||||||||||||||||||||||||||||||||||||||||||||||||||
|
Dependent Variable |
||||||||||||||||||||||||||||||||||||||||||||||||||||||||||||||||||||||||||||||||||||||||||||||||||
|
The equity premium is the difference between the return onthe portfolio of risky securities (capital gain + dividends) over the portfolio of risk-free treasury bills. |
||||||||||||||||||||||||||||||||||||||||||||||||||||||||||||||||||||||||||||||||||||||||||||||||||
|
Predictor Variables |
||||||||||||||||||||||||||||||||||||||||||||||||||||||||||||||||||||||||||||||||||||||||||||||||||
|
Dividend-price is the ratio of an aggregate dividend of the portfolio to a total market capitalisation of the portfolio at time ‘t’ |
||||||||||||||||||||||||||||||||||||||||||||||||||||||||||||||||||||||||||||||||||||||||||||||||||
|
Dividend-yield is measured as the ratio of an aggregate dividend of the portfolio at the time ‘t’ to the total market capitalisation of the portfolio at the time ‘t-1’ |
||||||||||||||||||||||||||||||||||||||||||||||||||||||||||||||||||||||||||||||||||||||||||||||||||
|
Earnings-price is the ratio of aggregate earnings of the portfolio to the total market capitalisation of the portfolio at the time ‘t’ |
||||||||||||||||||||||||||||||||||||||||||||||||||||||||||||||||||||||||||||||||||||||||||||||||||
|
Earnings-yield is measured as the ratio of aggregate earnings of the portfolio at the time ‘t’ to the total market capitalisation of the portfolio at time ‘t-1’
|
||||||||||||||||||||||||||||||||||||||||||||||||||||||||||||||||||||||||||||||||||||||||||||||||||
We have used Wong, Hassan, and Feroz (2007) and Welch and Goyal (2008)method for the estimation of equity premium using the dividends ratios and earnings ratios as predictor variables. We carried out both the in-sample and out-sample estimations for the robustness of the model by dividing the dataset two viz., the in-sample (70%, i.e. 2004 to 2013 data) and out-of-sample data (30%, i.e. 2013 – 2015 data). We used OLS multiple regression techniques for mean estimation and the ARMA-GARCH estimation for conditional mean-variance estimations, for taking care of serial correlation and heteroscedasticity problems in the residuals. The base model is represented mathematically in (1). The ARMA (P, Q) -GARCH (p,q) representations are given in (2) and (3).
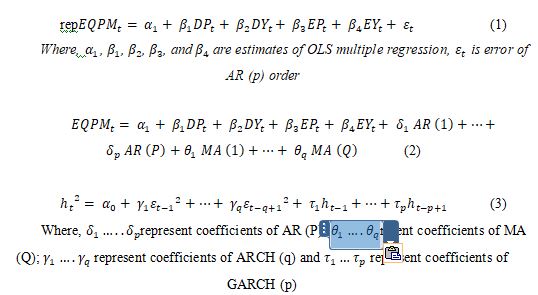
In the in-sample estimation, we have done the conditional mean forecasting of equity premium using the multiple OLS regression with best-fit ARMA-GARCH model for adjusting for the non-linearity in residuals viz., serial correlation and the heteroscedasticity problems. The OLS regression estimates provide the degree of the linear relationship of the equity premium with the predictor variables. The estimates are unbiased if the residuals of the model satisfy the properties of CLRM (Classical Linear Regression Model), i.e. BLUE (Best Linear Unbiased Estimators). The presence of significant autocorrelation and heteroscedasticity in the residuals violate the assumption of i.i.d. (identical independent distribution). We also checked the series for non-stationarity and multi-collinearity issues. The non-stationary series produce spurious regression estimates. In order to test for the non-stationarity of the dependent and independent variables, we used the unit root tests (e-views version 8) viz., the ADF (Augmented Dickey-Fuller) test and the PP (Philip-Peron- Fisher Chi-square) tests, for testing the null hypothesis that the series has a unit root (non-stationary). The null hypothesis is rejected at 5% level of significance if the ADF and PP statistics are higher than the respective critical values. We performed the VIF test (Variance Inflation Factor) for testing the multicollinearity of the predictor variables in the general estimation model (1) across each portfolio. If VIF > 10, then there is no multicollinearity among independent variables. We took EQPM as the dependent variable, and the computed EP, EY, DP and DY ratios are taken as independent variables for carrying out the OLS multiple-regression. The residual diagnostics tests of the residuals of the OLS regression showed auto-correlation and heteroscedasticity problems. We fitted the best-fit ARMA-GARCH model, which was selected based on the SIC (Schwarz Information Criteria) for the conditional mean-variance estimation of the equity premium.
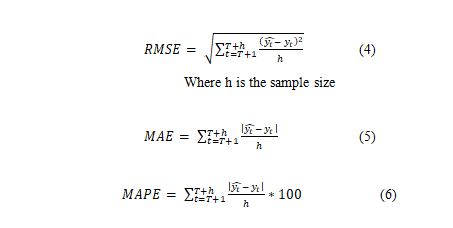
The out-of-sample forecasting is done using the n-step ahead conditional forecasting of the equity premium using the in-sample estimates. The robustness of the best-fit in-sample model is ascertained by computing RMSE (Root Mean Squared Error), MAE (Mean Absolute Error) and MAPE (Mean Absolute Percentage Error) values for both in-sample and out-sample data. The RMSE, MAE and MAPE predict the forecast accuracy of the estimation model. They are computed using (4), (5) and (6).
The forecast accuracy measures for both in-sample and out-sample data are compared for robustness. A robust estimation model should produce accurate estimates for the out-sample data
Table 2 provides the summary statistics of the variables for cross-sectional portfolios. The aggregate earnings and dividends ratios viz., EP, EY, DP and EY for all the portfolios are found to be non-normally distributed (skewness ≠ 0 and kurtosis ≠ 3). The estimated average equity premium is ranging from 0.7% – 0.8% for the portfolios. The estimated average equity premium is more for BM Low (0.81%) and MK Low (0.80%) and less for BM High (0.71%) and MK High (0.71%) portfolios, implying higher risk-premium for small size (MK Low) and value portfolios (BM Low). The findings support the size effect and value effect (Banz, 1981; Basu, 1983; Chan, Hamao, & Lakonishok, 1991; Chan, Jegadeesh, & Lakonishok, 1995; Fama & French, 1992, 1993, 1996, 2006, 2012)
|
Portfolio |
Mean |
Median |
Std. Dev |
Variance |
Max |
Min |
Kurtosis |
Skewness |
Count |
|
BM High |
|||||||||
|
EQPM |
0.7176 |
0.7614 |
0.2520 |
0.0635 |
1.1841 |
0.0000 |
-0.7712 |
-0.4032 |
125 |
|
EP |
0.1112 |
0.1203 |
0.0495 |
0.0025 |
0.2685 |
0.0335 |
-0.0348 |
0.4302 |
125 |
|
EY |
0.1103 |
0.1193 |
0.0499 |
0.0025 |
0.2579 |
0.0000 |
-0.0566 |
0.3181 |
125 |
|
DP |
0.0315 |
0.0282 |
0.0223 |
0.0005 |
0.0867 |
0.0000 |
-0.9551 |
0.3972 |
125 |
|
DY |
0.0314 |
0.0279 |
0.0225 |
0.0005 |
0.0867 |
0.0000 |
-0.9707 |
0.4069 |
125 |
|
BM Low |
|||||||||
|
EQPM |
0.8140 |
0.8566 |
0.1843 |
0.0340 |
1.1660 |
0.0000 |
1.6972 |
-0.7869 |
125 |
|
EP |
0.2400 |
0.2337 |
0.0769 |
0.0059 |
0.4538 |
0.0986 |
0.4561 |
0.6612 |
125 |
|
EY |
0.2391 |
0.2328 |
0.0780 |
0.0061 |
0.4538 |
0.0000 |
0.6339 |
0.4022 |
125 |
|
DP |
0.0358 |
0.0180 |
0.0330 |
0.0011 |
0.1319 |
0.0001 |
0.1212 |
1.1940 |
125 |
|
DY |
0.0352 |
0.0184 |
0.0328 |
0.0011 |
0.1320 |
0.0000 |
0.3794 |
1.2863 |
125 |
|
EP High |
|||||||||
|
EQPM |
0.7321 |
0.7750 |
0.2047 |
0.0419 |
1.1337 |
0.0000 |
-0.1610 |
-0.4093 |
125 |
|
EP |
0.0741 |
0.0707 |
0.0303 |
0.0009 |
0.1850 |
0.0205 |
2.0352 |
1.2518 |
125 |
|
EY |
0.0737 |
0.0684 |
0.0308 |
0.0010 |
0.1828 |
0.0000 |
1.9682 |
1.1199 |
125 |
|
DP |
0.0213 |
0.0229 |
0.0111 |
0.0001 |
0.0469 |
0.0009 |
-1.1079 |
0.1201 |
125 |
|
DY |
0.0213 |
0.0226 |
0.0112 |
0.0001 |
0.0454 |
0.0000 |
-1.1256 |
0.1154 |
125 |
|
EP Low |
|||||||||
|
EQPM |
0.7927 |
0.8661 |
0.2246 |
0.0504 |
1.1542 |
0.0000 |
-0.1112 |
-0.7065 |
125 |
|
EP |
0.1492 |
0.1566 |
0.0924 |
0.0085 |
0.4976 |
0.0255 |
1.4396 |
0.8249 |
125 |
|
EY |
0.1497 |
0.1560 |
0.0936 |
0.0088 |
0.4724 |
0.0000 |
0.3419 |
0.6390 |
125 |
|
DP |
0.0296 |
0.0147 |
0.0363 |
0.0013 |
0.1440 |
0.0001 |
2.2605 |
1.8538 |
125 |
|
DY |
0.0294 |
0.0148 |
0.0367 |
0.0013 |
0.1505 |
0.0000 |
2.6869 |
1.9485 |
125 |
|
MK High |
|||||||||
|
EQPM |
0.7178 |
0.7627 |
0.1749 |
0.0306 |
1.0441 |
0.0000 |
0.9063 |
-0.6048 |
125 |
|
EP |
0.1746 |
0.1552 |
0.0640 |
0.0041 |
0.3752 |
0.0725 |
0.5154 |
0.9683 |
125 |
|
EY |
0.1739 |
0.1583 |
0.0650 |
0.0042 |
0.3410 |
0.0000 |
0.1770 |
0.7329 |
125 |
|
DP |
0.0199 |
0.0123 |
0.0146 |
0.0002 |
0.0708 |
0.0020 |
1.7769 |
1.4060 |
125 |
|
DY |
0.0197 |
0.0129 |
0.0144 |
0.0002 |
0.0705 |
0.0000 |
1.7834 |
1.4021 |
125 |
|
MK Low |
|||||||||
|
EQPM |
0.8003 |
0.8481 |
0.2824 |
0.0798 |
1.2852 |
0.0000 |
-0.8257 |
-0.3260 |
125 |
|
EP |
0.1053 |
0.1075 |
0.0681 |
0.0046 |
0.2526 |
0.0083 |
-1.0650 |
0.2991 |
125 |
|
EY |
0.1052 |
0.0979 |
0.0693 |
0.0048 |
0.2530 |
0.0000 |
-1.0563 |
0.3059 |
125 |
|
DP |
0.0597 |
0.0287 |
0.0672 |
0.0045 |
0.2746 |
0.0000 |
1.1758 |
1.5231 |
125 |
|
DY |
0.0599 |
0.0294 |
0.0685 |
0.0047 |
0.2891 |
0.0000 |
1.5910 |
1.6081 |
125 |
Table 3 provides the results for the stationarity of the in-sample data. It is observed that the p-values of the ADF test and the PP-Fisher test are significant at 5% level of significance, i.e. p<< 0.05, the null-hypothesis of unit-root (non-stationary) is rejected. Therefore, the series is stationary at level.
|
|
|
|
|
|
|
Method |
Statistic |
Prob.** |
Cross-sections |
Observations |
|
Null: Unit root (assumes common unit root process) |
||||
|
Levin, Lin & Chu t* |
0.40258 |
0.6564 |
30 |
2916 |
|
Null: Unit root (assumes individual unit root process) |
||||
|
Im, Pesaran and Shin W-stat |
-1.79004 |
0.0367 |
30 |
2916 |
|
ADF - Fisher Chi-square |
85.7878 |
0.0161 |
30 |
2916 |
|
PP - Fisher Chi-square |
156.913 |
0.0000 |
30 |
2940 |
|
|
|
|
|
|
Table 4 describes the results for multi-collinearity of the predictor variables. It is observed that the VIF >> 10 for all the variables of the estimation model for all the portfolio. Therefore, there is no problem with multicollinearity among predictor variables.
|
OLS Model/Portfolio |
Variables |
VIF |
|
BM High |
EP_BMHIGH |
60.20005 |
|
EY_BMHIGH |
57.73873 |
|
|
DP_BMHIGH |
102.9117 |
|
|
DY_BMHIGH |
103.3876 |
|
|
BM Low |
DP_BMLOW |
65.50051 |
|
DY_BMLOW |
66.38482 |
|
|
EP_BMLOW |
53.64268 |
|
|
EY_BMLOW |
50.38351 |
|
|
EP High |
DP_EPHIGH |
93.5656 |
|
DY_EPHIGH |
93.44293 |
|
|
EP_EPHIGH |
71.22695 |
|
|
EY_EPHIGH |
67.53738 |
|
|
EP Low |
DP_EPLOW |
89.83399 |
|
DY_EPLOW |
88.97493 |
|
|
EP_EPLOW |
88.21873 |
|
|
EY_EPLOW |
83.54424 |
|
|
MK High |
DP_MKHIGH |
102.3738 |
|
DY_MKHIGH |
104.9051 |
|
|
EP_MKHIGH |
45.94443 |
|
|
EY_MKHIGH |
45.95151 |
|
|
MK Low |
DP_MKLOW |
17.96127 |
|
DY_MKLOW |
16.95436 |
|
|
EP_MKLOW |
98.53914 |
|
|
EY_MKLOW |
95.96268 |
Table 5 shows the estimates of the OLS multiple-regression model for the in-sample data. The best-fit ARMA-GARCH estimation technique is used for conditional mean-variance estimation of the equity premium. We found, AR (2) for BMHigh and MKHigh portfolios; AR(1)-GARCH(0,1) for BMLow and EPHigh portfolios; and AR (1) for EPLow and MKLow portfolios, respectively, as the best-fit conditional mean and conditional mean-variance equations. The adjusted R2 were 0.97 (BMHigh), 0.81 (BMLow), 0.82 (EPHigh), 0.92 (EPLow), 0.89 (MKHigh) and 0.95 (MKLow). The adjusted R2 of 0.97 implies that 97% of the variation in the equity premium is explained by the predictor variables (estimation model) for BMHigh portfolios. The residual diagnostic tests showed no heteroscedasticity and no ARCH effects. The DW statistics showed serial correlations in the residuals, as DW ≠ 2 for all portfolios. The F-statistic is significant for all estimation models. The results showed that all the estimated coefficients are significant at 5% level of significance for BMHigh (except intercept), EPHigh, EPLow, MKHigh and MKLow portfolios. However, for BMLow portfolio, the variation in dividend-price and dividend-yield ratios didn’t significantly influence the change in equity premium as the coefficient estimates were not significant at 5% level. It is observed that price-ratios are negatively associated with equity premium, and yield-ratios are positively associated with equity premium for all portfolios (except MKLow, where, DP is positively associated with equity premium). This implies that a decrease in dividends and earnings at a time‘t’ reduces the equity premium available for shareholders. However, equity premium increases as the dividend-yield and earnings-yield ratios increase for all the stocks.
|
Best-fit OLS Model |
Variable |
Coefficient |
SE |
t-stat/ z-stat |
p-value |
Adj. R2 |
F-stat |
DW |
|
BM HIGH |
||||||||
|
AR(2) |
DP |
-7.622 |
1.337 |
-5.702 |
0.000 |
0.975 |
579.862 |
1.906 |
|
DY |
8.317 |
1.233 |
6.743 |
0.000 |
||||
|
EP |
-1.995 |
0.335 |
-5.960 |
0.000 |
||||
|
EY |
1.985 |
0.263 |
7.556 |
0.000 |
||||
|
C |
1.408 |
1.438 |
0.979 |
0.330 |
||||
|
AR(1) |
0.527 |
0.070 |
7.573 |
0.000 |
||||
|
AR(2) |
0.462 |
0.069 |
6.684 |
0.000 |
||||
|
BM Low |
||||||||
|
AR(1) - GARCH (0,1) |
DP |
-1.580 |
1.353 |
-1.168 |
0.243 |
0.805 |
2.675 |
|
|
DY |
2.031 |
1.784 |
1.138 |
0.255 |
||||
|
EP |
-1.336 |
0.140 |
-9.536 |
0.000 |
||||
|
EY |
1.501 |
0.175 |
8.561 |
0.000 |
||||
|
C |
0.820 |
0.150 |
5.447 |
0.000 |
||||
|
AR(1) |
0.953 |
0.044 |
21.565 |
0.000 |
||||
|
RESID(-1)^2 |
0.602 |
0.223 |
2.700 |
0.007 |
||||
|
EP High |
||||||||
|
AR(1) - GARCH (0,1) |
DP |
-10.563 |
1.556 |
-6.786 |
0.000 |
0.820 |
2.348 |
|
|
DY |
11.973 |
1.326 |
9.032 |
0.000 |
||||
|
EP |
-2.751 |
0.452 |
-6.084 |
0.000 |
||||
|
EY |
2.495 |
0.509 |
4.907 |
0.000 |
||||
|
C |
0.860 |
0.177 |
4.849 |
0.000 |
||||
|
AR(1) |
0.974 |
0.020 |
49.202 |
0.000 |
||||
|
RESID(-1)^2 |
0.959 |
0.287 |
3.344 |
0.001 |
||||
|
EP Low |
||||||||
|
AR (1) |
DP |
-2.588 |
1.144 |
-2.261 |
0.026 |
0.928 |
251.116 |
2.375 |
|
DY |
3.574 |
1.072 |
3.336 |
0.001 |
||||
|
EP |
-2.454 |
0.273 |
-8.995 |
0.000 |
||||
|
EY |
2.983 |
0.287 |
10.394 |
0.000 |
||||
|
C |
0.702 |
0.062 |
11.358 |
0.000 |
||||
|
AR(1) |
0.867 |
0.040 |
21.785 |
0.000 |
||||
|
MK High |
||||||||
|
AR (2)
|
DP |
-14.370 |
2.604 |
-5.517 |
0.000 |
0.898 |
141.518 |
2.267 |
|
DY |
15.566 |
2.611 |
5.962 |
0.000 |
||||
|
EP |
-0.885 |
0.180 |
-4.925 |
0.000 |
||||
|
EY |
1.043 |
0.182 |
5.732 |
0.000 |
||||
|
C |
0.730 |
0.092 |
7.946 |
0.000 |
||||
|
AR(1) |
0.483 |
0.082 |
5.863 |
0.000 |
||||
|
AR(2) |
0.445 |
0.079 |
5.656 |
0.000 |
|
|
|
|
|
MK Low |
||||||||
|
AR (1) |
DP |
0.544 |
0.257 |
2.113 |
0.037 |
0.955 |
417.138 |
2.605 |
|
DY |
0.680 |
0.257 |
2.652 |
0.009 |
||||
|
EP |
-3.625 |
0.524 |
-6.920 |
0.000 |
||||
|
EY |
4.847 |
0.458 |
10.593 |
0.000 |
||||
|
C |
0.601 |
0.076 |
7.896 |
0.000 |
||||
|
AR(1) |
0.871 |
0.046 |
19.043 |
0.000 |
||||
Notes: Column 1 shows the type of best-fit ARMA-GARCH model used. Column 2 represents the estimated variables. Column 3 shows the coefficients of the estimation. Column 4 shows the standard error of the estimates. Column 5 shows the t-statistic/ z-statistic value of the estimates. The tests are done for the statistical significance of the estimates. Column 6 shows the p-value of the estimates. The p-value < 0.05 implies that the estimates are highly significant at 5% level. Column 7 shows the adjusted R2, which shows the goodness-of-fit of the model. Column 8 shows the F-statistic value of the regression, which is a proxy for the significance of the regression (higher F-statistic). Column 9 shows the Durbin-Watson value for serial-correlation in the residuals. DW =2 implies there is no auto-correlation in residuals.
Table 6shows the forecast accuracy measures for in-sample and out-sample estimations. The predictor variables performed well in in-sample estimation for BMHigh, BMLow, MKHigh portfolios as the forecast errors measured by RMSE, MAE and MAPE were less (<< 10%) compared to that of EP High, EPLow and MKLow portfolios, where RMSE and MAPE were greater. (For EPHigh, RMSE= 12%, MAPE = 17%; EPLow, RMSE = 10%, MAPE=14%; MKLow, RMSE = 10%, MAPE=14% respectively). The out-sample measures viz., RMSE and MAE are greater for BMLow, EPLow, MKHigh and MKLow portfolios indicating the poor out-sample performance of the estimation models. However, the dividends and earnings-ratios acted as best in-sample and out-sample predictors for EPHigh portfolio.
|
Portfolio |
ARMA-GARCH type |
In-sample estimation |
Out-sample estimation |
|
|||||||
|
Obs. |
RMSE |
MAE |
MAPE |
Obs. |
RMSE |
MAE |
MAPE |
||||
|
BM High |
AR (2) |
96 |
6.575% |
5.098% |
11.148% |
26 |
42.549% |
3.457% |
3.464% |
||
|
BM Low |
AR(1) - GARCH (0,1) |
98 |
8.510% |
6.261% |
9.375% |
28 |
9.831% |
7.727% |
7.588% |
||
|
EP High |
AR(1) - GARCH (0,1) |
98 |
12.428% |
9.538% |
17.177% |
26 |
6.001% |
5.301% |
5.328% |
||
|
EP Low |
AR (1) |
98 |
10.481% |
8.987% |
14.054% |
26 |
14.890% |
13.815% |
13.738% |
||
|
MK High |
AR (2) |
97 |
7.137% |
6.027% |
9.65% |
26 |
10.533% |
8.866% |
9.727% |
||
|
MK Low |
AR (1) |
98 |
10.054% |
8.641% |
14.919% |
26 |
16.190% |
14.144% |
13.678% |
||
The standard financial models failed to account for the large return differentials in the expected stock returns over the risk-free rate, leading to the puzzle of equity premium documented by Mehra and Prescott (1985). The proponents of market efficiency attributed the higher risk-premium to the macro-economic consumption of representative agents, measured by aggregate dividends and earnings of firms (Campbell and Cochrane, 2000; Fama and French, 1988; Goyal and Welch, 2008). In our study, we estimated cross-sectional equity premiums using aggregate dividends and earnings ratios. The equity premium varies accordingly with firm characteristics, risk-free rates and predictor variables (Damodaran, 2009; 2012). Therefore, we used the cross-sectional portfolios formed based on market capitalisation (firm size), BM ratio and EP ratios. The OLS multivariate regression techniques, along with the best-fit ARMA-GARCH model, were used for the estimation of conditional mean-variance equations of the expected equity premiums for in-sample and out-sample data. We found that both dividends-ratios and earnings-ratios acted as best in-sample predictors for all portfolios except the Value (BMLow) portfolio. The dividends ratios didn’t significantly estimate the equity premium for BMLow portfolio, and the results are incongruent with the findings of Goyal and Welch (2008) that time-varying dividend-ratios predicted themselves better than predicting equity premium. The poor out-sample estimation shows that, though the aggregate dividends and earnings partly explained the cross-sectional equity premiums, they acted as weaker predictors given their random walk behaviour (Goyal and Welch, 2008). Thus, our estimation techniques don’t contribute to providing any solid explanation for the anomalous behaviour of equity premium nor the uncertainty surrounding the predictability of the expected equity premium. Thus, there is a need for further research to explore robust techniques involving behavioural variables along with firm variables reflecting the economic behaviour to explain the behaviour of excess equity returns better.
Banz, R. W. (1981). The relationship between return and market value of common stocks. Journal of Financial Economics, 9(1), 3–18. https://doi.org/10.1016/0304-405X(81)90018-0
Basu, S. (1983). The Relationship between Earnings’ Yield, Market Value and Return for NYSE common stocks. Journal of Financial Economics, 12, 129–156. https://doi.org/10.1016/0304-405X(83)90031-4
Benartzi, S., & Thaler, R. H. (1995). MyopicLossAversion and the Equity Premium Puzzle. The Quarterly Journal of Economics, 110(1), 73–92.
Berk, J. B. (1995). A Critique of Size-Related Anomalies. Review of Financial Studies, 8(2), 275–286. https://doi.org/10.1093/rfs/8.2.275
Black, F. (1972). Capital Market Equilibrium with Restricted Borrowing. The Journal of Business, 45(3), 444. https://doi.org/10.1086/295472
Campbell, J Y, & Cochrane, J. H. (1999). By force of habit: A consumption-based explanation of aggregate stock market behaviour. Journal Of Political Economy, 107(2), 205–251. https://doi.org/10.1086/250059
Campbell, John Y., & Cochrane, J. H. (1999). By Force of Habit: A Consumption‐Based Explanation of Aggregate Stock Market Behavior. Journal of Political Economy, 107(2), 205–251. https://doi.org/10.1086/250059
Campbell, John Y., & Cochrane, J. H. (2000). Explaining the poor performance of consumption-based asset pricing models. Journal of Finance, 55(6), 2863–2878. https://doi.org/10.1111/0022-1082.00310
CHAN, L. K. C., HAMAO, Y., & LAKONISHOK, J. (1991). Fundamentals and Stock Returns in Japan. The Journal of Finance, 46(5), 1739–1764. https://doi.org/10.1111/j.1540-6261.1991.tb04642.x
Chan, L. K. C., Jegadeesh, N., & Lakonishok, J. (1995). Evaluating the performance of value versus glamour stocks The impact of selection bias. Journal of Financial Economics, 38(3), 269–296. https://doi.org/10.1016/0304-405X(94)00818-L
Claus, J., & Thomas, J. (2001). Equity premia as low as three percent? Evidence from analysts’ earnings forecasts for domestic and international stock markets. JOURNAL OF FINANCE, 56(5), 1629–1666. https://doi.org/10.1111/0022-1082.00384
Constantinides, g. M. (1990). Habit formation - a resolution of the equity premium puzzle. Journal of political economy, 98(3), 519–543. https://doi.org/10.1086/261693
Damodaran, A. (2009). Equity risk premiums (ERP): Determinants, estimation and implications - A post-crisis update. Financial Markets, Institutions and Instruments. https://doi.org/10.1111/j.1468-0416.2009.00151.x
Damodaran, A. (2012). Equity Risk Premiums ( ERP ): Determinants, Estimation and Implications – The 2012 Edition Updated : March 2012. Review Literature And Arts Of The Americas. https://doi.org/10.2139/ssrn.2027211
Dimson, E., Marsh, P., & Staunton, M. (2008). The Worldwide Equity Premium: A Smaller Puzzle. Handbook of the Equity Risk Premium, 44(April), 467–514. https://doi.org/10.1016/B978-044450899-7.50023-3
Fama, E. F., & French, K. R. (1992). The Cross‐Section of Expected Stock Returns. The Journal of Finance, 47(2), 427–465. https://doi.org/10.1111/j.1540-6261.1992.tb04398.x
Fama, E.F., & French, K. R. (2002). The Equity Premium. The Journal of Finance, 57(2), 637–659. https://doi.org/10.1136/pgmj.29.336.522
Fama, Eugene F., & French, K. R. (1988). Dividend yields and expected stock returns. Journal of Financial Economics, 22(1), 3–25. https://doi.org/10.1016/0304-405X(88)90020-7
Fama, Eugene F., & French, K. R. (1993). Common risk factors in the returns on stocks and bonds. Journal of Financial Economics, 33(1), 3–56. https://doi.org/10.1016/0304-405X(93)90023-5
Fama, Eugene F., & French, K. R. (1996). Multifactor Explanations of Asset Pricing Anomalies. The Journal of Finance, 51(1), 55–84. https://doi.org/10.1111/j.1540-6261.1996.tb05202.x
Fama, Eugene F., & French, K. R. (2006). The value premium and the CAPM. Journal of Finance, 61(5), 2163–2185. https://doi.org/10.1111/j.1540-6261.2006.01054.x
Fama, Eugene F, & French, K. R. (2012). Size, value, and momentum in international stock returns. JOURNAL OF FINANCIAL ECONOMICS, 105(3), 457–472. https://doi.org/10.1016/j.jfineco.2012.05.011
Gebhardt, W. R., Hvidkjaer, S., & Swaminathan, B. (2005). Stock and bond market interaction: Does momentum spill over? JOURNAL OF FINANCIAL ECONOMICS, 75(3), 651–690. https://doi.org/10.1016/j.jfineco.2004.03.005
Kahneman, D., & Tversky, A. (1979). Prospect Theory: An analysis of Decision under Risk. Econometrica, 47(2), 263–292.
Lintner, J. (1965). The Valuation of Risk Assets and the Selection of Risky Investments in Stock Portfolios and Capital Budgets. The Review of Economics and Statistics, 47(1), 13. https://doi.org/10.2307/1924119
Mehra, R., & Prescott, E. C. (1985). Equity premium puzzle. Journal of Monetary Economics, 15, 145–161. https://doi.org/10.1016/0304-3932(85)90061-3
Sharpe, W. F. (1964). Capital Asset Prices: A theory of market equilibrium under conditions of risk. Journal Of Finance, XIX(3), 425–442. https://doi.org/10.1017/S0043887113000221
Siegel, J. J. (1992). The real rate of interest from 1800-1990 - a study of the united-states and the uk. Journal of monetary economics,29(2), 227–252. https://doi.org/10.1016/0304-3932(92)90014-S
Siegel, J. J., & Thaler, R. H. (1997). Anomalies: The Equity Premium Puzzle. Journal of Economic Perspectives. https://doi.org/10.1257/jep.11.1.191
Weil, P. (1989). The equity premium puzzle and the risk-free rate puzzle. Journal of Monetary Economics, 24(3), 401–421. https://doi.org/10.1016/0304-3932(89)90028-7
Welch, I. (2000). Views of Financial Economists on the Equity Premium and on Professional Controversies. The Journal of Business, 73(4), 501–537. https://doi.org/10.1086/209653
Welch, I., & Goyal, A. (2008). A comprehensive look at the empirical performance of equity premium prediction. Review of Financial Studies. https://doi.org/10.1093/rfs/hhm014
Wong, S. Q., Hassan, N. R., & Feroz, E. (2007). The equity premium puzzle: An artificial neural network approach. Review of Accounting and Finance, 6(2), 150–161. https://doi.org/10.1108/14757700710750829

