|
Faisal Ahmed Associate Professor International Business Area FORE School of Management New Delhi faisal@fsm.ac.in |
Sumeet Kaur Associate Professor , Quantitative Techniques and Operations Management Area FORE School of Management New Delhi skaur@fsm.ac.in |
The Arctic Council comprises of eight countries and India became its Observer member as a non-circumpolar country in 2013. In this paper, we estimate India’s export potential with the Arctic Council countries using an augmented gravity model of trade. We employ panel data of merchandise exports for the period 2005-17 and use pooled effects, fixed effects, random effects, and first difference effects to derive results. The findings reveal that in both basic as well as augmented model estimations, and with either fixed effects or first difference effects, India has the potential to increase its exports to all the eight countries. However, the results are different in cases of using pooled and random effects. Whereas, India’s export potential is found to exist only for Canada and Norway in case of random effect in basic model estimations, all the eight countries are found to be overtraded when random effect is applied to the augmented model. So, it is evident that with fixed effects estimations, the result seems to be quite optimistic. The findings of this research would be useful for academics, industry and policy-making in context of policy planning and resource allocation for merchandise goods. It can also be used for initiating future studies on potential for trade in services between India and the Arctic Council countries, especially for those estimations where merchandise trade have been found to be overtraded.
Keywords: Gravity Model, Arctic Council, India, Export Potential
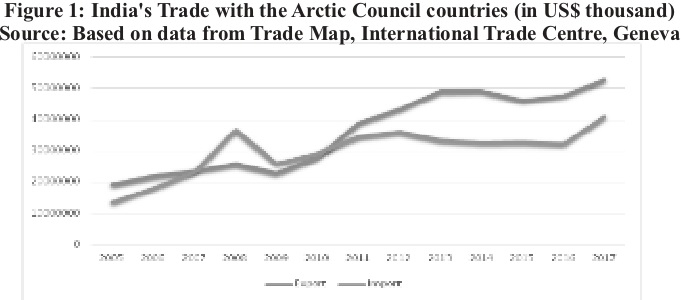
The Arctic Council constitutes of eight member countries viz. the United States, Canada, Finland, Norway, Sweden, Denmark, Iceland, and the Russian Federation. Bailes (2014) explained the advantages of sub-regional initiatives and argued that there are several geo-strategic commonalities within them. The same is evident in Arctic council countries as well owing to their cooperation on polar research. These commonalities include historical familiarity, shared experiences, common interests, also vis-à-vis outsiders, easier local/popular understanding. Some important aspects of the governance and economic engagements of the Arctic Council countries includes issues related to an international regime, the China factor and membership of politico-economic congregations. Rothwell (2008) called for a new regional treaty comparable with the Antarctic Treaty aimed at protecting the sovereign rights and interests of the region. Scholars have also been discussing about the issue of governance in the Arctic region. Young (2012) advocated that the biophysical and socio-economic transformations in the Arctic is creating a need for governance in the circumpolar north. He called for exploring the prospects for developing an Arctic regime complex without any complacency. In fact, the European Union in March 2008 identified the Arctic as a geo-economical new frontier. And later in May 2008, the five Arctic Ocean coastal states viz. Denmark, Norway, United States, Canada, and Russia had announced the Ilulissat Declaration. This declaration sought commitment from the signatories to ensure co-existence and engage in dialogue to develop the Arctic Ocean, to settle territorial claims as per the United Nations Convention on Law of the Sea of 1982, and to ensure a responsible shipping route management in the future. China too is a non-circumpolar member of the Arctic Council, and is engaging with the region quite intensely in key areas such as maritime infrastructural development. China will benefit from the Northeast Passage owing to less costs associated with logistics because of shorter trips (Campbell, 2013). Moreover, Hong (2018) argues that China’s policy goals in the Arctic is to understand, protect, develop and participate in the governance of the Arctic. In January 2018, China went a step ahead to design its Arctic Policy. Its policy document asserts that non-circumpolar countries have rights in the Arctic to conduct scientific research, navigation, fishing, laying of submarine cables and pipelines in the high seas as per the obligations envisaged under the UNCLOS and international law. India, China and few Arctic Council countries are also members of the Group of 20 (G20), while China and some Arctic Council countries are members of the Asia-Pacific Economic Cooperation (APEC). In the evolving world order and given the geo-economic interests of both India and China in the Arctic Council countries, G20 and APEC membership too creates a significant impact on the nature of engagements. The formal engagement between India and the Arctic Council countries can be traced back to the Spitsbergen Treaty of February 1920. This treaty, now known as Svalbard Treaty affirmed the sovereignty over Svalbard, an archipelago in the Arctic Ocean. The original signatories of this treaty comprised of fourteen countries including the United Kingdom and its dominions of Australia, Canada, India, among few others. Presently, forty-six countries are signatories of this treaty. India has an evolving trade relation with these countries and the trade statistics reveals a growing trajectory, with United States being the largest trading partner. India’s export to the Arctic Council accounted for US$52.66 billion in 2017 while the import stood at US$40.85 billion (see Figure 1). Given this backdrop, it is imperative to study India’s potential role and trade with the Arctic Council countries. Thus, in this paper, we estimate India’s export potential to these countries using the gravity model of trade. This paper thus attempts to contribute to the literature in the following ways:
a)	It discusses the global role and possible trade potential of a non-circumpolar country in the Arctic Council. As Hong (2018) has discussed about China’s policy goals in the Arctic, and that China has rolled out its Arctic Policy as well, it becomes imperative that other Observer states including India should also prepare a roadmap for engagement. Trade is an important instrument, but it is evident that India’s trade with most of the Arctic Council members is not up to potential.
b)	Our study uses an augmented gravity model by adding unconventional variables like G20 membership and Asia-Pacific Economic Cooperation (APEC membership) in the panel data estimations. There are several studies e.g. Batra (2004), Pradhan (2006), and others mentioned in the literature review section of this paper, which have employed gravity model to estimate trade potential. Though these studies have included some of the Arctic Council countries as well, but in the current scenario of global economic governance, the estimations would be more pragmatic if G20 and APEC considerations are incorporated in the equations.
The remainder of the paper is organised as follows. The second section of this paper presents a review of literature of topical relevance. In the third section, the methodology has been presented. It includes the augmented gravity model of trade used in this study and its statistical equation. The fourth section of the paper presents the analysis and findings. And finally, the last section concludes the study. Our study covers a total of 8 Arctic Council countries. These countries viz. the United States, Canada, Finland, Norway, Sweden, Denmark, Iceland and Russia are included in our sample for the analysis of Indian exports during the period 2005-2017.
Literatures on Arctic Council are largely related to climate change concerns, Arctic resources, conflict over resources, polar code, polar transportation, and role of non-circumpolar countries. Some studies (e.g. Kriz and Chrástanský, 2012; Molenaar, 2012; O’Leary, 2012; Smits et al., 2014; Arruda, 2015; Basaran, 2017) have discussed about the marine resources and the resource conflicts pertaining to EEZ laws in the Arctic. In fact, Kriz and Chrástanský (2012) have argued that there has been limited development of human activity in the Arctic, and presents three reasons for that. These include those related to harsh climatic conditions, restricted technological development for economic or military use, and finally, the marginalisation of the region itself based on perceptions. But, another study by Anderson (2012) explained the nature of Arctic shipping and advocated for suitable environmental provisions in the Polar Code being proposed at that time. An earlier study by Brigham (2007) has argued that with the rise in temperature, Arctic region will experience an increase in transportation and global access, but will also face challenges pertinent to natural resource and climate refugees. He developed four scenarios for the Arctic in 2040 viz.
•	Globalised frontier: where Arctic becomes integration to global economic architecture and polar transportation becomes a reality
•	Adaptive frontier: where circumpolar countries looks at deepening regional Arctic cooperation in areas of economy and environment
•	Fortress frontier: where there exist conflicts related to resource exploitation among the stakeholder countries, and,
•	Equitable frontier: where development strategy emphasises gradualism and there exists mutual respect and cooperation among the circumpolar economies.
Moreover, the studies focusing on the international trade aspects of the Arctic Council have been very limited in terms of usage of modelling. Since we have used the gravity model of trade for estimations, and augmented it using new variables as well, it is imperative to review the use and methodological considerations of this model. On the methodological aspect, the gravity model of trade has been one of the most widely used in the area of international trade to assess the trade potential. In social sciences, the application of gravity model was first proposed by James Stewart in the 1940s (Fitzsimons et al., 1999), but the model found it first application in the field of international trade by Tinbergen (1962). Several contemporary studies adopt the gravity models developed by Linnemann (1966). Also, Anderson (1979) showed that the gravity framework is consistent with a model of world trade in which products are differentiated by the country of origin. The gravity model of trade has been used both with cross sectional as well as panel data. There are estimations of fixed effects model as well. Winters and Soloaga (1999) discussed the issue of including fixed effects in the gravity model and fixed effect was also used by Egger and Pfaffermayr (2003). We have thus used panel data regression and carried out estimations using pooled effects, fixed effects, random effect and also first difference effects. As far as the use of gravity model of trade in context of finding potential of India’s trade is concerned, there have been very few studies. For instance, Batra (2004) calculated the trade potential between India and all the other countries using gravity model approach. But this study used the cross-sectional data. Later, Pradhan (2006) analysed the trade potential between India and countries of Gulf Cooperation Council countries. Some recent studies that have used gravity model of trade focused on other regions include Novy (2011), Diaz and Delgadillo (2013), and Anderson (2016), among others.
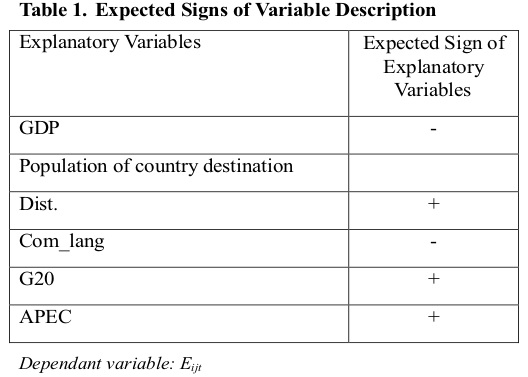
We focus on panel data estimations using the gravity model of trade. Our study covers a total of 8 Arctic Council countries. These countries viz. the United States, Canada, Finland, Norway, Sweden, Denmark, Iceland and Russia are included in our sample for the analysis of Indian exports during the period 2005-2017. There has been lot of empirical studies in estimating trade potential of a country or a regional congregation. Arguably, the gravity model estimations have been found to be quite helpful in explaining it. The log linear form of the basic gravity model is given as equation 1. Log (Eij) = α + β1 Log (GDPi) + β2 Log (population country destination) +β3Log (Dist.) + ε .. (1) Where, Eij is the bilateral trade between Country i and Country j; GDPi is the economic mass (generally taken as Gross Domestic Product) of Country i; and, Dist. is the actual or great circle geographical distance between the two countries i and j; β1, β2 and β3are coefficients to be estimated, whileε is the error term. In this study, we have used an augmented form of the gravity model by using certain relevant dummy variables. We thus estimatean augmented gravity equation for India’s global trade flows. The model equation has been estimated withordinary least square technique using panel data.The standard gravity model includes GDP, population of country origin, and distance as independent variables and three dummy variables as in equation 2 (see Table 1):
ln(Eijt) = α + β1 ln(GDPi) + β2 ln(Pop.) +β3ln(Dist.) +β4(Com_lang)+ β5(G20) + β6(APEC) + ε .. (2)
Where,
•	Exports (Eijt) is the exports from country i to its trading partner country j in time t. It is a dependent variable in the study. The data for exports has been taken from database of the International Trade Centre, Geneva. The data is for the period 2005-2017.
•	GDPj is the gross domestic product (GDP) of the partner country j (in constant US$ 2010). There are many ways of measuring the size of countries in the gravity model, either by considering GDP or by taking the population data or at times both. This study however considers taking GDP data to represent the economic size as is used by most studies cited in review of literature section of this paper. The data for GDP (measured in constant US$ 2010) in this study has been taken from World Development Indicator (WDI, World Bank), 2017.
•	Pop. is the population of the partner countryj
•	Dist. is the distance between the capital cities of country i and j. It is measured as the great-circle distance between the two latitude-longitude combinations. It can be calculated through capital cities or the economic centres of the two countries. In our study, the data for distance has been taken from CEPII, France dataset.In fact, distance becomes a significant variable in gravity equation because it is considered a proxy for transport costs.
•	Com_lang is a dummy variable and stands for common official language. In context of international trade, this variable is crucial as it is expected to reduce transaction costs of negotiations. Data for Com_lang in this study have been taken from CEPII, France dataset. This variable takes the value of 1 if the two countries share a common language, otherwise it will take the value of 0.
•	G20 is another dummy variable used in our study. This variable assumes the value of 1 if the two countries i and j are both G20 members. Inclusion of this variable is significant in this context as G20 countries includes both G8 and BRICS countries and have a larger say in global economic governance. But not all Arctic Circle countries are G20 members.This variable data of current membership has been taken from the web site of G20. It assumes the value of 1 if country j is also a G20 members, otherwise a value of 0 is assigned.
•	APEC is also a dummy variableand assumes the value of 1 if country j is an Asia-Pacific Economic Cooperation (APEC) member. There are 20 member countries of APEC. This is significant because India already has trade agreements and close economic ties with all the APEC members, but not all Arctic Council countries are APEC member. In this study, this variable assumes the value of 1 if country j is an APEC member. The data is based upon the membership status available on the APEC web site.
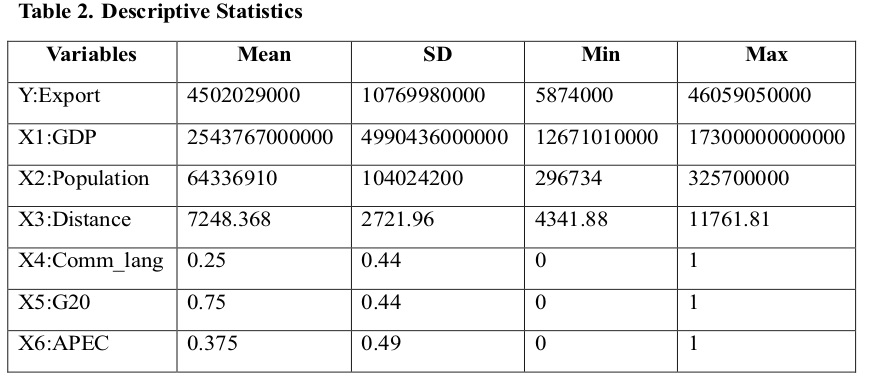
Based on equation 2, the estimations include one dependant variable and six explanatory variables of which three are dummy variables which assume the values of 0 or 1. All the variables (excluding dummies) have been expressed in natural logarithm. The dependent variable represents the flow of exports from India to the Arctic Council countries. The descriptive statistics of the variables are presented in Table 2.
All estimates have been checked for heteroscedasticity. These estimations have ascertained the relevant relationships over time and monitors the pairs individually for the Arctic Council countries as well as for the Artic Council as a congregation. We have usedpanel data with pooled effect, fixed effect, random effect. Also, first difference estimations have been used and we have calculatedthe export potential of India on the basis of coefficients derived therein.The results have been presented in Table 3 for the basic gravity model. The different parts of Table 3 viz. 3(a), 3(b), 3(c) and 3(d) presents the estimations with pooled effect, with fixed effect, with random effect, and with first difference effect, respectively. For each of these results, the equations have been presented along with the sub-tables. In fact, the advantage of panel data method isthat it can indicate the relationship between variables over time, and avoid biased estimates. Pooled regression is the normal OLS regression carried out on entire panel data.A pooled model includes all the years into a large data set and treat them as separate observations. Fixed effect model has been used to analyse the impact of time-varying variables. Also, random effect model has been used to include time invariant variables they also influence dependent variables. Also, the first difference effect model has been used to depict the year on year change in each variable within a country. We then run the regression in these differences,but in this case we use all the year-to-year changes.
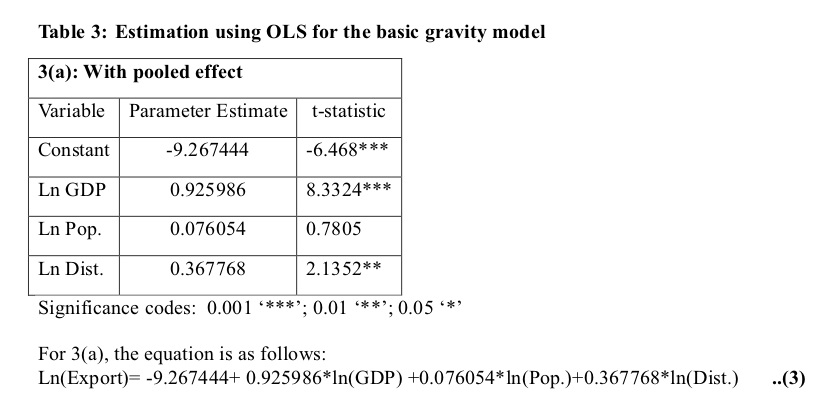
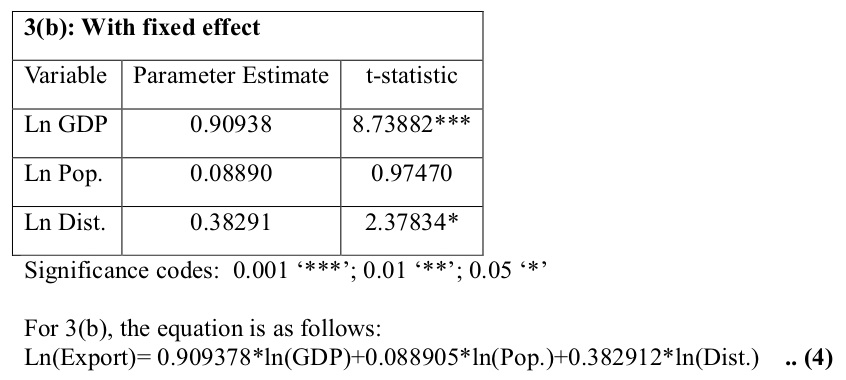
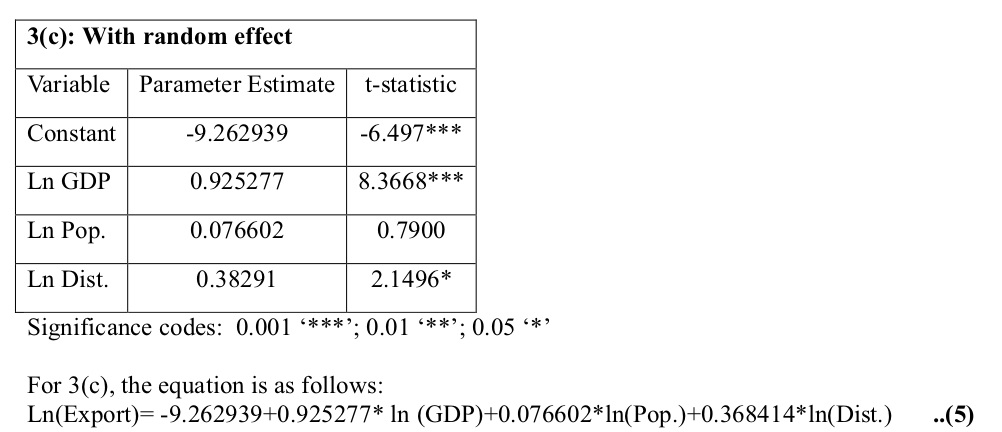
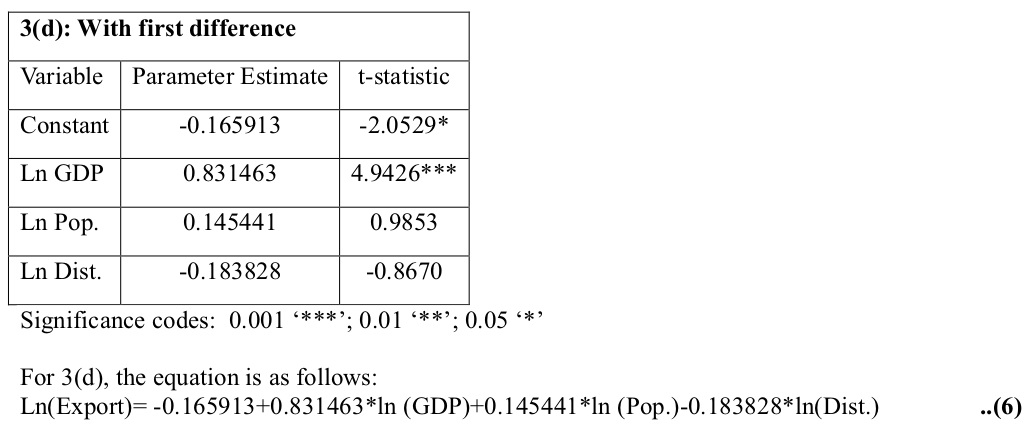
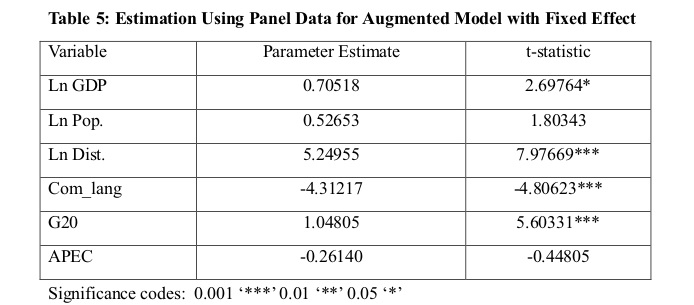
Table 4 can be expressed as follows:
Ln(Export)= -57.08371+0.85454*ln(GDP)+0.37191*ln(Pop.)+5.49339*ln(Dist.)-4.78217*(Com_lang)+1.3180*(G20) +0.05082*(APEC)					..(7)
All the explanatory variables are significant at 5% level of significance. The Adjusted R2 is 0.7646 i.e. 76.46% of the variability in the total exports between India and its trading partners can be explained by the fixed effects model.
Other findings include:
F-test: 469.271, p-value:2.2e-16< 0.05. The value of F-test indicates that the model is highly significant at 1% level.
Hence alternative hypothesis is accepted i.e. pooled effect model is effective in interpreting the exports. The coefficient of the partner country’s GDP variable in our specification is positive, statistically significant and economically reasonable indicating that higher GDP increases trade. The estimated coefficient on Log of distance has the anticipated sign and is greater than one, indicating that trade between a pair of countries falls by a little percent for every percent increase in the distance between them. The estimated coefficient on log population country destination has the anticipated sign and is greater than one, indicating that trade between a pair of countries falls by a little percent for every percent increase in the population between them. The estimated coefficient for the dummy G20 and APEC shows a positive sign and a value of more than 1, indicating that countries that are part of G20 and APEC group they are likely to trade more.
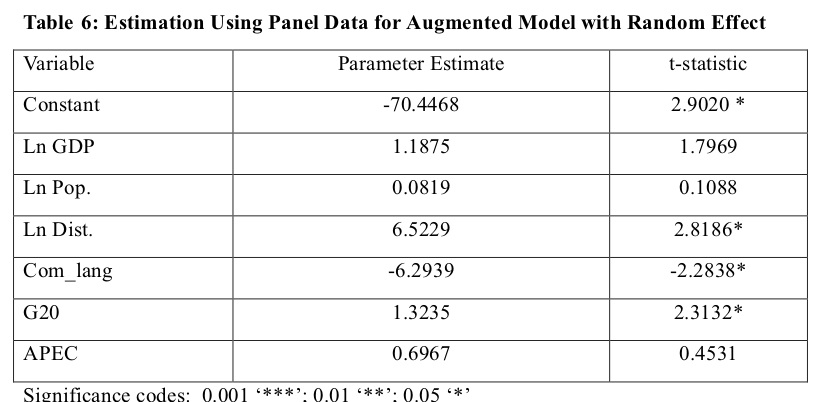
Table 5 can be expressed as the following equation:
Ln(Export)= 0.70518*ln(GDP)+0.52653*ln(Pop.)+5.24955*ln(Dist.)-4.3121*(Com_lang)+1.04805 *(G20)-0.2614*(APEC)								..(8)
Adjusted R2: 0.77607 ie. 77.61 % of the variability in the total exports between India and its trading partners can be explained by the fixed effects model.
F test: 703.146, p-value:2.22e-16< 0.05. The value of F-test indicates that the model is highly significant at 1 percent level.
Hence alternative hypothesis is accepted i.e. fixed effect model is effective in interpreting the export.
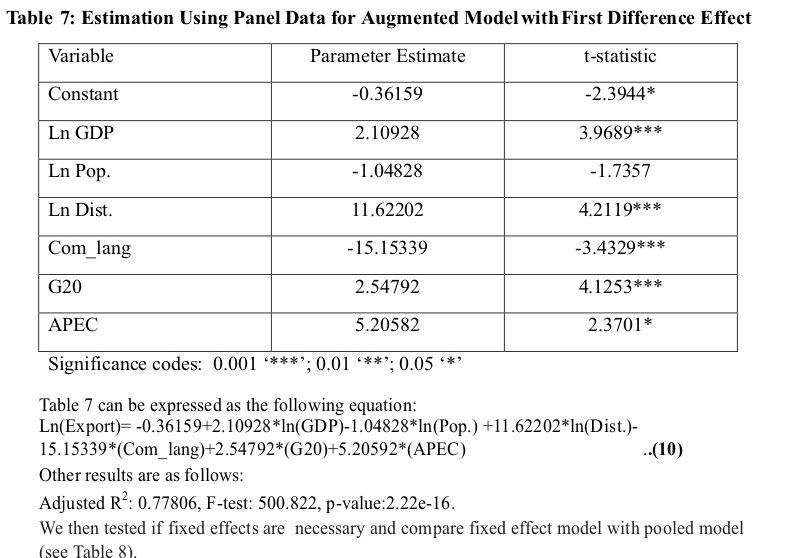
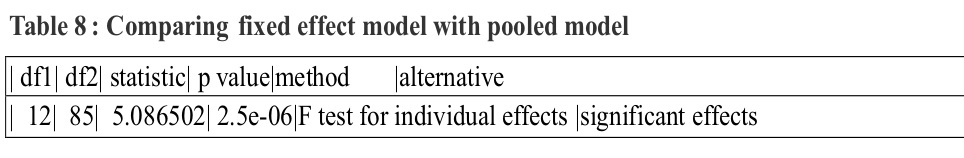
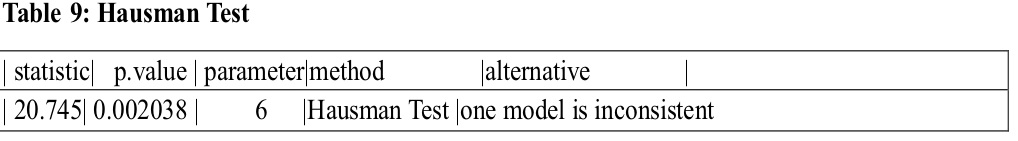
Table 5 reveals that, as p-value< 0.05, the null hypothesis of no fixed effects is rejected. This implies that, as compared to pooled model, fixed effect model is better. Further, in order to test the null hypothesis that the regressors and individual effects are not correlated, we perform the Hausman test. Table 9 shows a low p-value of the test, which indicates that the null hypothesis saying that the individual random effects are exogenous is rejected, which makes the random effects equation inconsistent. In this case the fixed effects model is the correct solution.
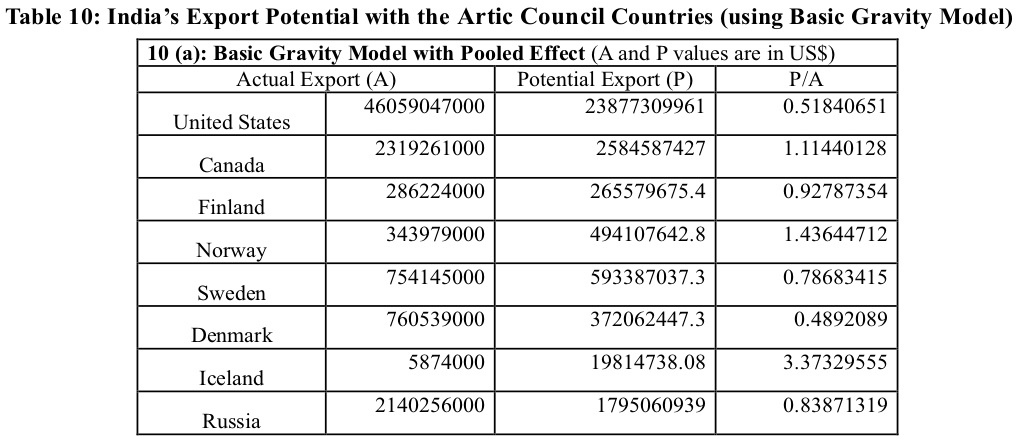
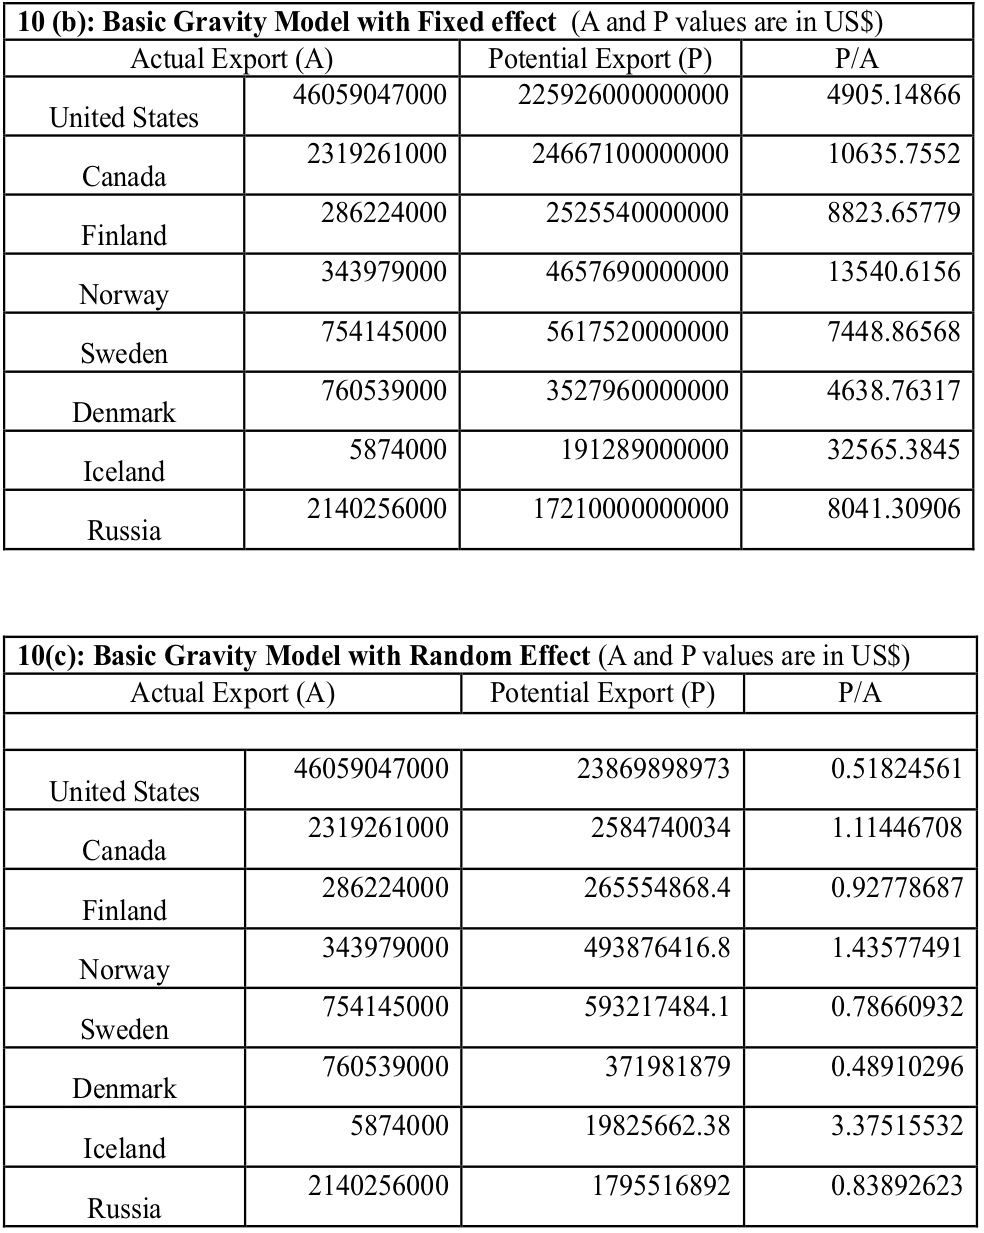
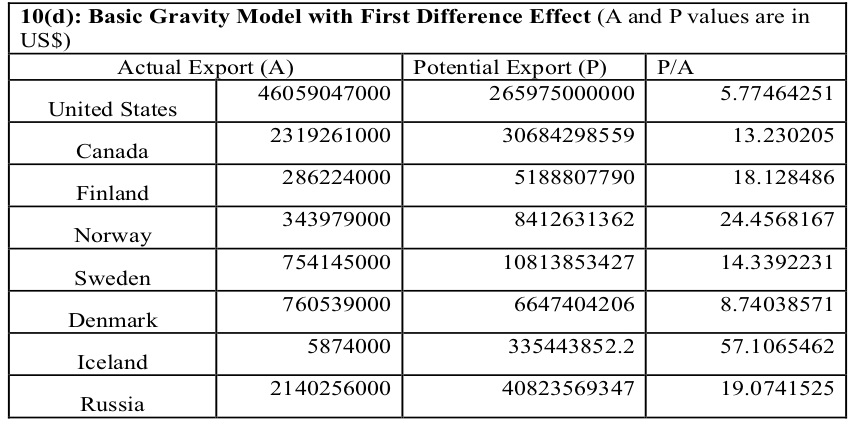
Incorporating the estimated coefficients of the dependent variable, all explanatory variables and the dummies in equation (2), we calculated the export potential using the values of the variables. Then in order to know the magnitude of export potential we calculated the ratio of potential trade values and the actual trade values. We analyse the results for the augmented gravity model for fixed effects, pooled effects and random effects.The dataset fits well for both the basic and augmented gravity model in our analysis. The standard features and power of explanatory variables in the regression are impressive. The baseline variables are highly significant and have the expected signs and are of reasonable magnitude. Using the coefficients of the augmented gravity model, we have estimated India’s export potential with the Arctic Council countries. The ratio of export potential (P) as predicted by the model and actual exports (A) i.e. P/A is then used to analyse India’s export potential with these eight countries, on the basis of actual export figures for the year 2017. If the value of P/A exceeds one, then there is potential for expansion of exports with the respective country. Table 10 shows India’s estimated export potential with all the Arctic Council countries using the basic gravity model. Table 10(a) estimates the model using pooled effect and the result reveals that India has potential to expand its exports to Canada, Iceland and Norway; and with Canada and Norway as in Table 10(c) using random effect. But if we consider the fixed effect as in Table 10(b), India has the potential to increase its exports to all the Arctic Council countries; and the same is true when we estimated it using first difference effect as in Table 10(d).
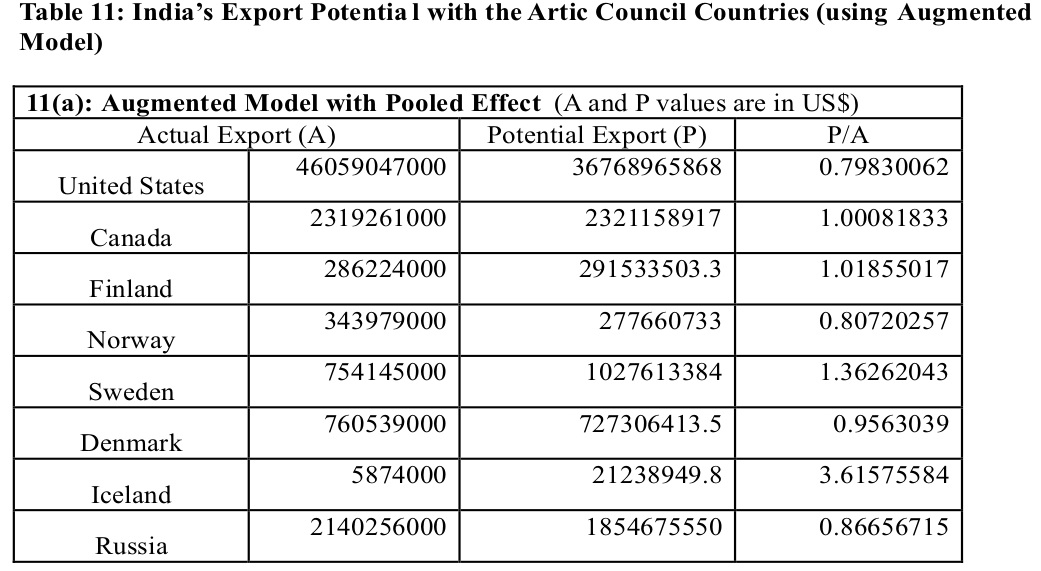
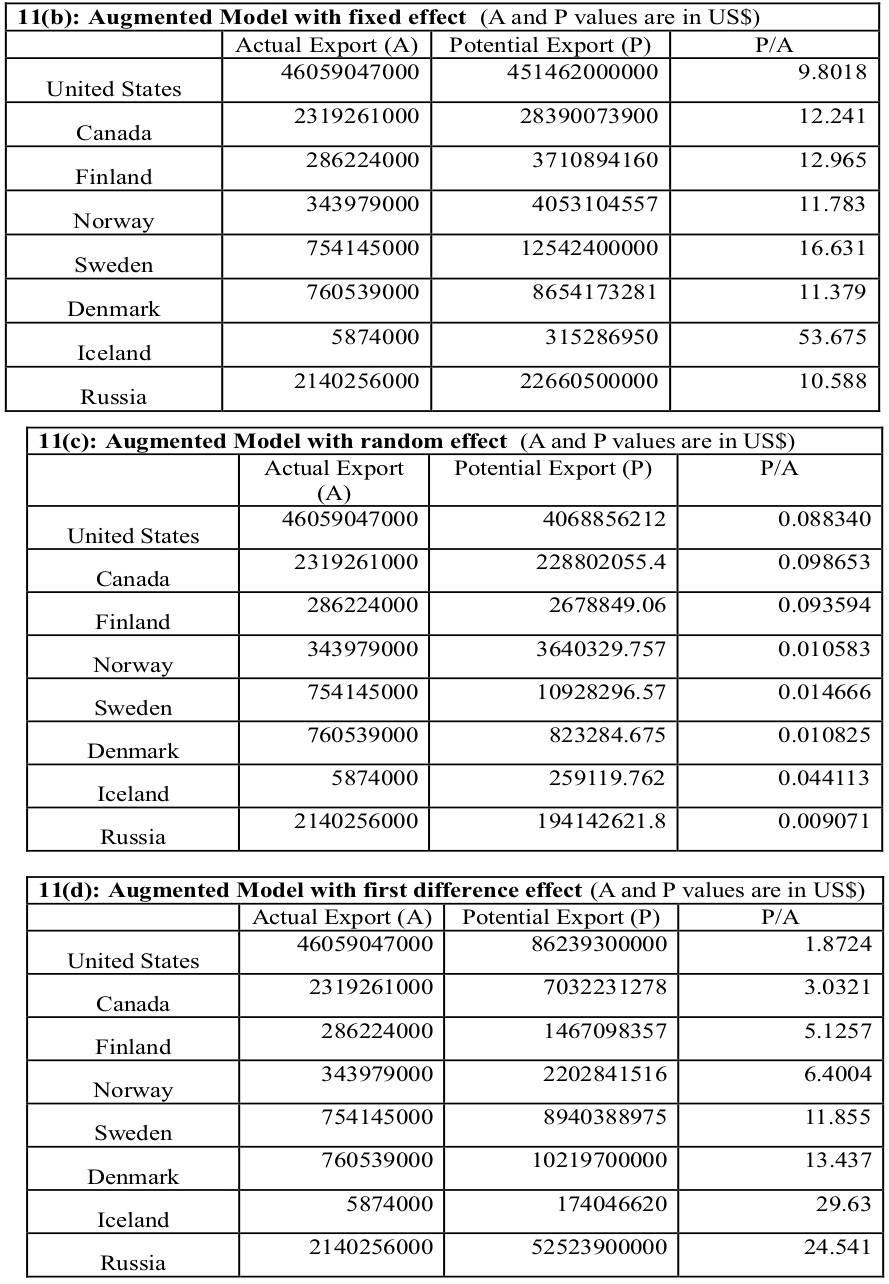
Again, we use the coefficients of the augmented gravity model to estimate India’s export potential with the Arctic Council countries. The P/A ratio is calculated in case of the Augmented Model. Table 11 shows that India’s estimated export potential with all the Arctic Council countries using the augmented gravity model. Table 11(a) estimates the model using pooled effect and the result reveals that India has potential to expand its exports to Canada, Finland and Iceland; but when we applied random effect, none of the countries of the Arctic Council could be found to have further potential for Indian exports. They were found to be overtraded, as depicted in Table 11(c). But if we consider the fixed effect as in Table 11(b), India has the potential to increase its exports to all the Arctic Council countries; and the same is true when we estimated it through first difference effect also, as in Table 11(d).
We estimated India’s export potential to the eight Arctic Council countries. Since there have been limited academic studies on the Arctic Council, with most of them concentrating on environmental aspects, this paper attempts to fill the gap in the discourse on trade potential with the Arctic countries. Wehave used an augmented gravity model of trade and applied pooled effect, fixed effect, random effect and first difference effect on the panel data. The ratio of export potential (P) as predicted by the model and actual exports (A) as available in the trade dataset for year 2017 has been calculated.The P/A ratio is then used to analyse India’s export potential with these eight countries, on the basis of actual export figures for the year 2017. But with random effect estimations, India is found to have export potential to only few countries. Interestingly, Basaran (2017)mentioned about non-circumpolar observer states and advocated that they be also considered stakeholders in activities related to natural resources of the Arctic. So, it is imperative that the non-circumpolar countries, and especially those with an Observer status in the Arctic Council e.g. India and China will have a larger role through trade participation and resource mobilisation in the region. Moreover, since our study focuses only on merchandise goods, further studies can be carried out to assess the role of services sector and its potential therein.
The infrastructural support provided by FORE School of Management, New Delhi is greatly appreciated.
1.	Anderson, H Edwin (2012). Polar Shipping, The Forthcoming Polar Code and Implications for the Polar Environments, Journal of Maritime Law and Commerce, 43(1), 59-83.
2.	Anderson, J. E. (1979). A theoretical foundation for the gravity equation. The American Economic Review, 69(1), 106-116
3.	Anderson, J. E. (2014). Trade, Size, and Frictions: The Gravity Model.
4.	Arruda, G.M. (2015). Arctic governance regime: the last frontier for hydrocarbons exploitation. International Journal of Law and Management, 57(5), 498-521.
5.	Bailes, A. J. (2014). Understanding The Arctic Council: A'Sub-Regional'Perspective. Journal of Military and Strategic Studies, 15(2), 31-49.
6.	Basaran, I. (2017). The Future of Arctic Navigation: Cooperation between the International Maritime Organization and Arctic Council. Journal of Maritime Law and Commerce, 48(1), 35-52.
7.	Batra, A. (2004). India’s Global Trade Potential: The Gravity Model Approach, Indian Concil for Research on International Economic Relations, WP, No. 151.
8.	Brigham, Lawson W. (2007). Thinking about the Arctic’s Future: Scenarios for 2040, The Futurist,September-October issue, 27-34.
9.	Campbell, C. (2013). China and the Arctic: objectives and obstacles. US-China Economic and Security Review Commission, Available: http://library.arcticportal.org/1677/1/China-and-the-Arctic_Apr2012.pdf
10.	Díaz, R.C.L. and Delgadillo, C.X.B. (2013). A Gravity Model for the Exports of Nicaragua”, Central Bank of Nicaragua, ISSN 2409-1863.
11.	Egger, P., & Pfaffermayr, M. (2003). The proper panel econometric specification of the gravity equation: A three-way model with bilateral interaction effects. Empirical Economics, 28(3), 571-580.
12.	Fitzsimons, E., Hogan, V., & Neary, J. P. (1999). Explaining the volume of North-South trade in Ireland: A gravity model approach. Economic and Social Review, 30(4), 381-401.
13.	Hong, N. (2018). China's Interests in the Arctic: Opportunities and Challenges, Institute for China-America Studies, Washington DC, Available: http://chinaus-icas.org/wp-content/uploads/2018/03/2018.03.06-China-Arctic-Report.pdf
14.	Kríz, Z. and Chrástanský, F. (2012). Existing Conflicts in the Arctic and the Risk of Escalation: Rhetoric and Reality, Perspectives, 20(1), 111-140.
15.	Linneman, H. (1966). An Econometric Study of International Trade Flows. Amsterdam: North-Holland.
16.	Molenaar, E.J. (2012). Arctic fisheries and international law: Gaps and options to address them, Carbon and Climate Law Review, 6(1), 63-77.
17.	Novy, D. (2011). Gravity Redux: Measuring International Trade Costs with Panel Data, University of Warwick.
18.	O'Leary, R. (2012). Protecting the Arctic Marine Environment: The limits of Article 234 and the need for multilateral approaches. Journal of Environmental Law and Practice, 23, 253-270.
19.	Pradhan, S.R. (2006). India’s Export Potential to the Gulf Cooperation Council (GCC) Countries: A Gravity Model Analysis, Asia-Pacific Research and Training Network on Trade, In Post Workshop Reports,Second WTO/ESCAP ARTNeT Capacity Building Workshops on Trade Research, April 17-21.
20.	Rothwell, D. (2008). The Arctic in international affairs: time for a new regime. Brown Journal of World Affairs, 15(1), 241-253.
21.	Smits, C.C., van Tatenhove, J. P., and van Leeuwen, J. (2014). Authority in Arctic governance: changing spheres of authority in Greenlandic offshore oil and gas developments. International Environmental Agreements: Politics, Law and Economics, 14(4), 329-348
22.	Tinbergen, J. (1962). Shaping the World Economy: Suggestions for an International Economic Policy, New York: Twentieth Century Fund.
23.	Winters, A. and Soloaga, I. (1999). Regionalism in the nineties: What effect on trade?, Discussion Paper 2183, CEPR.
24.	Young, O.R. (2012). Building an international regime complex for the Arctic: current status and next steps. The Polar Journal, 2(2), 391-407.

