|
Toan Ngoc Bui Faculty of Finance and Banking Industrial University of Ho Chi Minh City (IUH), Vietnam. |
By employing Autoregressive Distributed Lag (ARDL) approach, this paper contributes in giving empirical evidence on the nexus between the macroeconomy and stock market performance. Despite being a familiar empirical research topic in developed stock markets, this is relatively new in emerging stock markets like Vietnam. Thus, the paper brings a deeper perspective in the causal relationship between the macroeconomy and the performance of emerging stock market. Like earlier research, stock market performance is measured by stock index (SI) in this paper. In addition, stock market turnover ratio (TR) is added to measure this performance. This is a new angle to analyze stock market performance as well as a novelty of this study compared with earlier counterparts. The findings confirm that stock market performance is negatively influenced by consumer price index in the short run and long run. Also, in the short run, economic growth (EG) and interest rate (IR) are correlated to how the stock market performs. These valuable results are essential for consideration by policy makers, scholars and investors, especially those in emerging markets.
Keywords:Performance, Stock market, Emerging market, ARDL, Vietnam.
Stock market has always attracted investors’ attention (Lin & Fuerst, 2014). This is an appealing investment channel with relatively high liquidity, low trading cost and especially more explicit trading information compared with other channels (Lin & Lin, 2011). During the investment in equity market, the performance is a key factor which investors specially consider. The market performance is a reference to provide investors an overall view on stock market as well as its attractiveness and then have a basis to make an investment decision effectively. More than that, macroeconomic factors are also much concerned by investors because stock market is quite sensitive to fluctuations of the macroeconomy. Therefore, its influence on how equity market performs is a major topic of engagement within the financial economics circus (Ouma & Muriu, 2014). The statistically significant effects of macroeconomic fundamentals on stock market return have been confirmed by many empirical research (Ouma & Muriu, 2014). However, this nexus is mainly found in developed markets, not in emerging ones (Lawal et al., 2018). To fill this gap, this study is conducted to analyze the link between the macroeconomy and stock market performance in Vietnam, an emerging market. Accordingly, it is expected to give first empirical evidence on this matter in Vietnam. The remaining part of the paper is structured as follows: section two provides relevant literature review and research hypothesis; section three deals with the data set and methodology utilized; section four presents the findings and discussion; finally, the last section offers the conclusion.
Stock market is where different forms of stock are bought and sold (Riyazahmed & Saravanaraj, 2015). It plays a key role in refinance interest raising fund (Awojobi, 2013) and distribute resources (Tease, 1993) in the economy. Further, stock market boosts firms perform efficiently, provides a fair investment environment for investors. Stock market return indicates an overall of market changes. It is thus usually measured by stock index (Ouma & Muriu, 2014). This measure has been adopted in almost all of similar empirical research. Beside, according to Pan và Mishra (2017), stock market turnover ratio is more appropriate than stock index in underpinning the development as well as the performance of stock market. In this section, a summary of relevant literature will be reviewed, mainly on selected macroeconomic dynamics which consist of economic growth, consumer price index and interest rate.
Economic growth is an important indicator of the economy (Bouchouicha & Ftiti, 2012). A healthy economy brings investors more opportunities to raise their profits and encourage them to invest more in stock market. As a result, the performance of equity market will improve. Hence, the link between economic growth and stock market return has well been recognized by a vast number of empirical studies. In fact, this topic has been much acknowledged by many scholars for many decades (Marques et al., 2013). Liang and Teng (2006) believed that economic growth has a significant impact on China stock market in the 1952-2001 period. Shahbaz et al. (2008) found out the positive nexus between economic growth and stock market in Pakistan from 1971 to 2006. In the same vein, Enisan and Olufisayo (2009) also confirmed this positive relation between them in Nigeria in the period of 1980-2004. By their study conducted in Portugal, Marques et al. (2013) contributed to the findings on this positive association from 1993 to 2011. Nevertheless, some scholars report that the performance of stock market is not influenced by economic growth. For instance, Ndako (2010) analyzed data in South Africa from the first quarter of 1983 to the fourth quarter of 2007. However, the findings could not indicate the statistically significant effect of economic growth on stock market turnover. Generally speaking, most of the earlier researchers agreed that economic growth can exert positive influence on stock market performance. Therefore, the following hypothesis is suggested:
H¬1: Economic growth has a positive impact on stock market performance.
Consumer price index indicates the relative change in price over time. This index is regarded as a tool to measure inflation rate of an economy. A highly increased consumer price index stimulates the rise in interest rate to assure a positive real interest rate. A highly increased consumer price index also causes many difficulties to firms by increasing input cost and indirectly influences equity market. Hence, several earlier research confirmed that consumer price index exerts a negative impact on stock market. Specifically, Akbar et al. (2011) revealed the negative effect of consumer price index on stock index KSE100 in the period from 1998 to 2008. In India, Naik and Padhi (2012) also identified the negative link between consumer price index and stock index from 2004 to 2011. In their study using data in Kuwait during the period of 2001-2010, Al-Shami and Ibrahim (2013) the casual relationship between consumer price index and stock price changes over time. In specific, consumer price index can lead to the increase in stock price after one month and the decrease after two months. Nonetheless, a mild consumer price index can foster stock market performance. Indeed, stock price is correlated to expected dividend (Gordon, 1962). Accordingly, an increased consumer price index can stimulate expectations in the economy and then raise the price of stock. Ratanapakorn and Sharma (2007) also asserted on the positive link between consumer price index and US stock market from 1975 to 1999. By their analysis in Malaysia, Asmy et al. (2010) confirmed that consumer price index positively influences stock price. In the same vein, by collecting data of 13 emerging stock markets in the 1984-2004 period, Bai and Green (2011) also agreed on the positive nexus between consumer price index and stock market. By their findings, Ouma and Muriu (2014) found that stock index is positively influenced by consumer price index in Kenya during the period 2003-2013. In a recent study, Alam (2017) also identified the positive association between consumer price index and stock index in India from 2005 to 2013. On the contrary, some scholars like Bampinas and Panagiotidis (2016) analysing US data announced that consumer price index exerts insignificant influence on equity market. In general, there have been a number of different views on the link between consumer price index and stock market return. In the research period, Vietnam economy was experiencing many predicaments (specifically the considerable increase in consumer price index) which makes the stock industry fall. Therefore, the author suggests a hypothesis as follows:
H¬2: Consumer price index has a negative impact on stock market performance.
Interest rate is an indicator of monetary policies and performed by central banks (Camilleri et al., 2019). As a result, interest rate has significant influence on how equity market performs (Iacoviello, 2005). In fact, the causal relationship between interest rate and stock market performance has been analysed in many empirical research such as those of Fama and French (1989), King and Watson (1996). Interest rate has a direct influence on capital use cost of a firm, so it influences the current value of net cash flow (as expected in the future) (Chen et al. 1986). In other words, high interest rate decreases the current value of a firm’s net cash flow, so there is a fall in its stock price (Sargent, 1999; Lawal et al., 2018). Thus, it can be said that interest rate is negatively associated with stock market performance. This finding has also been concluded by Humpe and Macmillian (2009), Hussain et al. (2013) and Alam (2017). Specifically, Ratanapakorn and Sharma (2007) reported that US stock index S&P500 is correlated positively to short-term interest rate and negatively to long-term ones. By utilizing data of 12 African countries, Iddrisu et al. (2017) noted the positive effects of interest rate on the return of stock market from 1997 to 2013. In their recent analysis, Camilleri et al. (2019) asserted that interest rate are positively correlated to stock index in Belgium in the period from 1999 to 2017. In contrast, it is believed that interest rate has insignificant impact on stock market in the long run. By researching the cases of France, Germany, the UK and Italy during the period 1990-2009, Laopodis (2011) reported that interest rate exert significant impact on equity market in the short run but insignificant influence on it in the long run. These findings corroborate those of the study conducted in France, Germany and the U.K by Peiró (2016). Thus, there have been opposing views on the nexus between interest rate and the performance of equity market but it is mainly stated to be negative. Hence, the author suggests the following hypotheis:
H¬3: Interest rate has a negative impact on stock market performance.
Data are collected quarterly from the third quarter of 2004 to the third quarter of 2018. The study utilizes the data in Vietnam, a country with an emerging stock market. Despite being launched officially in 2000, it was not until the end of 2004 that Vietnam stock market started its operation efficiently. That is why the author selects the data in this period. Data on stock market performance are collected from State Securities Commission of Vietnam (SSC). Data on economic growth and consumer price index are collected from General Statistics Office of Vietnam (GSO). About data on interest rate, the author used those from International Monetary Fund (IMF).
ARDL approach developed by Pesaran et al. (2001) and utilized by Shahbaz et al. (2008) is employed in this study to analyze the influence of the macroeconomy on stock market performance. One of its biggest advantages is the appropriateness for empirical research with short data series (Pahlavani et al., 2005) and research models with data series which are not stationary at the same level (Tursoy & Faisal, 2016). These features are suitable for Vietnam-specific data. Based on the previous findings, stock market performance (SMP) is commonly measured by stock index (SI). Further, the performance of stock market can be measured by stock market turnover ratio (TR) (Pan & Mishra, 2017). Accordingly, stock market turnover ratio is brought in the model as a measure. This is anticipated to be a novelty of the research. About macroeconomic factors, most scholars report that stock market return is significantly influenced by economic growth (EG), consumer price index (CP) and interest rate (IR). Thus, the suggested model takes the following equation: SMP = f (EG, CP, IR)
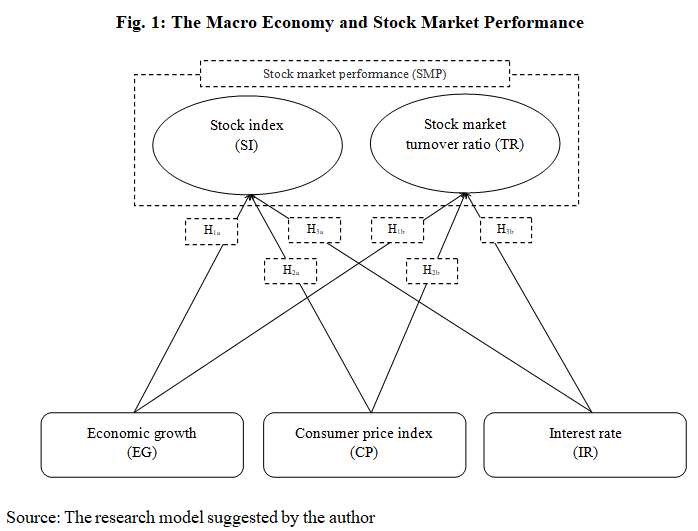
- Research model 1: SI = f (EG, CP, IR)
+ Impact in the long run:
SIt = β01 + β11 EGt + β21 CPt + β31 IRt + vt
+ Impact in the short run:

- Research model 2: TR = f (EG, CP, IR)
+ Impact in the long run:
TRt = β02 + β12 EGt + β22 CPt + β32 IRt + vt
+ Impact in the short run:
|
Variable name |
Code |
Source |
How to measure |
|
|
Dependent variables |
||||
|
Stock market performance |
Stock index |
SI |
SSC |
Logarithm of Vietnam stock index: log(VN-Index) |
|
Stock market turnover ratio |
TR |
SSC |
Total value of shares traded during the period divided by the average market capitalization for the period |
|
|
Independent variables |
||||
|
The macroeconomy |
Economic growth |
EG |
GSO |
Quarterly growth of gross domestic products (in comparison with the same period last year) |
|
Consumer price index |
CP |
GSO |
Quarterly growth of consumer price index (in comparison with the same period last year) |
|
|
Interest rate |
IR |
IMF |
Refinancing rate of central bank in the form of reloan according to credit documentation (quarterly average calculated) |
|
Source: compiled by the author on the basis of earlier research
|
Variable |
Mean |
Min |
Max |
|
Stock index (SI) |
2.7155 |
2.3640 |
3.0390 |
|
Stock market turnover ratio (TR) |
0.2931 |
0.0596 |
1.4531 |
|
Economic growth (EG) |
0.0658 |
0.0314 |
0.0945 |
|
Consumer price index (CP) |
0.0839 |
0.0000 |
0.2790 |
|
Interest rate (IR) |
0.0784 |
0.0500 |
0.1500 |
Source: Author's computation
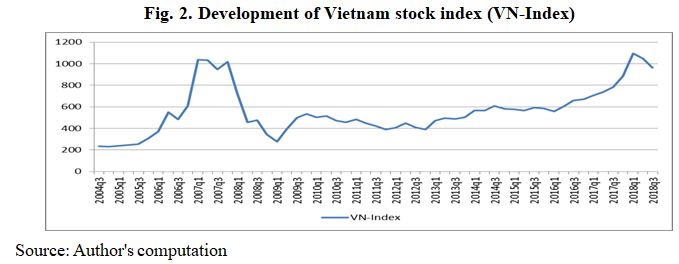
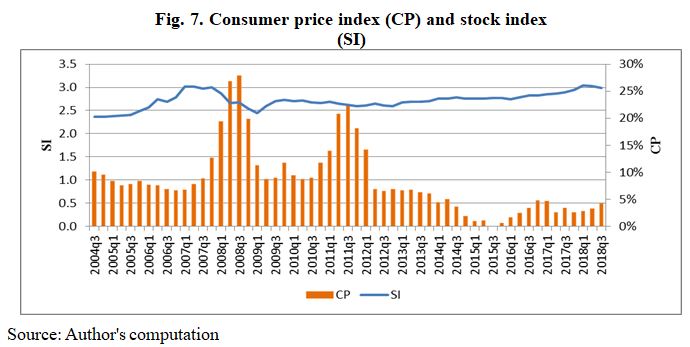
Fig. 2 indicates that Vietnam stock index increased significantly in the period of 2005-2007 when Vietnam economy developed considerably. Since 2008, stock index decreased gradually due to many national and global economic difficulties. It reached the bottom in the first quarter of 2009. This fall of Vietnam stock index lasted till the period of 2011-2012. Recently, thanks to some positive economic recovery, it has a comeback.
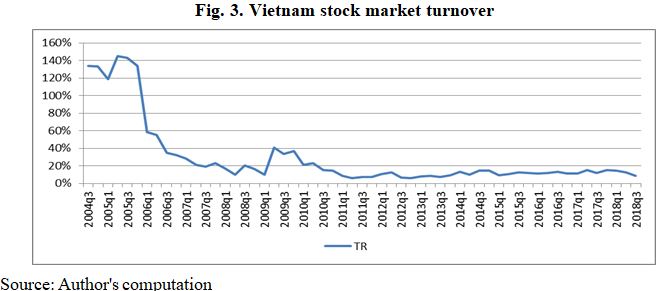
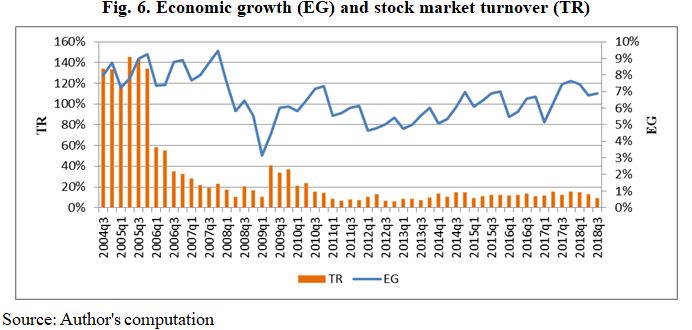
It can be seen from Fig. 3 that Vietnam stock market turnover reached its peak in the period from 2004 to 2006 when the size (value of market capitalization) of stock market is small. In recent years, its size has developed significantly and its turnover has become more stable.
|
Variable |
At Level |
At ∆ |
|
I(0) |
I(1) |
|
|
SI |
0.3537 |
0.0000*** |
|
TR |
0.0472** |
0.0000*** |
|
EG |
0.0454** |
0.0000*** |
|
CP |
0.4545 |
0.0016*** |
|
IR |
0.2414 |
0.0000*** |
Note: ***, ** represent significance at the 1% and 5% level, respectively. Source: Author's computation
Table 3 reports the results of stationarity test developed by Dickey and Fuller (1979). It can be noted that stock market turnover (TR) and economic growth (EG) are stationary at the root time series I(0) with the 5% level of significance. The other variables become stationary after first difference I(1) at the significance of 1%. In other words, both of the research models are correlated with ARDL approach.
By employing indicator of Bayesian Information Criterion (BIC), the lag of variables in the model is determined. Then, ARDL bound test suggested by Pesaran et al. (2001) is also used to test cointegration among data series.
|
Model 1: The impact of the macroeconomy on stock index (SI) F1 = 4.985 |
||||||||
|
|
10% |
5% |
1% |
p-value |
||||
|
I(0) |
I(1) |
I(0) |
I(1) |
I(0) |
I(1) |
I(0) |
I(1) |
|
|
F1 |
2.828 |
3.957 |
3.415 |
4.668 |
4.761 |
6.276 |
0.008*** |
0.036** |
|
Model 2: The impact of the macroeconomy on stock market turnover (TR) F2 = 7.562 |
||||||||
|
|
10% |
5% |
1% |
p-value |
||||
|
I(0) |
I(1) |
I(0) |
I(1) |
I(0) |
I(1) |
I(0) |
I(1) |
|
|
F2 |
2.848 |
3.942 |
3.432 |
4.642 |
4.771 |
6.215 |
0.000*** |
0.003*** |
Note: ***, ** represent significance of the 1%, 5% level respectively. Source: Author's computation
Table 4 reveals that the existence of a cointegration among the variables in the model 1 at 5% level of significant. Meanwhile, this cointegration in model 2 is at the level of 1%. It can be deduced that ARDL approach can be applied to analysed the two models.
|
Variable |
Model 1 (dependent variable: SI) |
Model 2 (dependent variable: TR) |
||
|
Coef. |
Prob. |
Coef. |
Prob. |
|
|
Long run results |
||||
|
EG |
5.2869 |
0.283 |
-4.1832 |
0.512 |
|
CP |
-2.4811 |
0.052* |
1.3728 |
0.405 |
|
IR |
-1.1309 |
0.741 |
-2.1411 |
0.628 |
|
Short run results |
||||
|
êEG |
0.9321 |
0.270 |
4.0672 |
0.014** |
|
êCP |
-0.4374 |
0.039** |
0.3066 |
0.432 |
|
êIR |
-1.1593 |
0.129 |
-0.4782 |
0.643 |
|
êIR(-1) |
2.1231 |
0.002*** |
|
|
|
êIR(-2) |
-1.8086 |
0.008*** |
|
|
|
ECM(-1) |
-0.1763 |
0.003*** |
-0.2233 |
0.000*** |
|
Constant |
0.4849 |
0.007*** |
|
|
|
Prob > F |
0.000*** |
0.000*** |
||
|
R-squared |
51.83% |
45.85% |
||
|
Autocorrelation test |
0.3202 |
0.4208 |
||
|
Heteroskedasticity test |
0.1138 |
0.4341 |
||
|
Normality test |
0.2400 |
0.7359 |
||
|
Ramsey reset test |
0.1937 |
0.2367 |
||
Note: ***, **, * represent significance at the 1%, 5%, 10% level respectively. Source: Author's computation
Table 5 indicates that both research models has statistical significance at the 1% level. The coefficient R-squared is 51.83% and 45.85%. Thus, the independent variables can be used to explained for 51.83 percent of fluctuation in stock and 45.85 percent of fluctuation in stock market turnover (TR). Based on results of autocorrelation and heteroskedasticity test, it can be concluded that there is no autocorrelation among errors and heteroscedasticity in both models. Concurrently, based on results of Reset test from Ramsey, we can assert that important variables are not omitted. Furthermore, Normality test concludes that the model errors are normally distributed. Hence, their results are appropriate and utilizable.
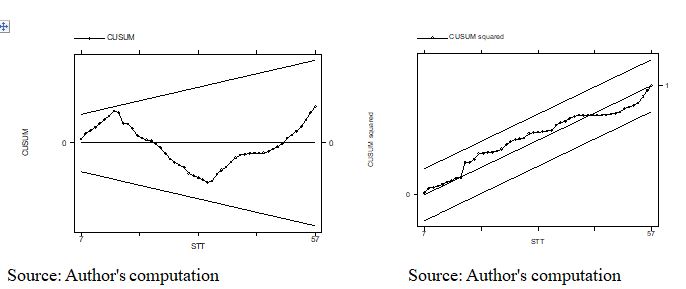
Results of stability test suggested by Brown et al. (1975) are reported in Fig. 4 and 5. According to them, cumulative sum of recursive residuals (CUSUM) and cumulative sum of squares of recursive residuals (CUSUM squared) are within the standard bound at the 5% level of significance. It can be concluded that the two models have stability. Table 5 also revealed the negative effect of consumer price index (CP) on stock index (SI) in the short run and long run. Additionally, in the short run, stock index is influenced by interest rate (IR) at the 1% significance level. In specific, interest rate exerts a positive influence (2.1231) on stock index at the lag of one quarter, then turns to a negative impact (-1.8086) at the lag of 2 quarters (Model 1). As can be shown in Model 2, economic growth (EG) is positively (4.0672) related to stock market turnover (TR) in the short run at the 5% of significance.
|
No |
Hypothesis |
Results |
||
|
Model 1 (dependent variable: SI) |
Model 2 (dependent variable: TR) |
|||
|
H1 |
Economic growth has a positive impact on stock market performance. |
EG ⟹ SMP |
Rejected |
Accepted |
|
H2 |
Consumer price index has a negative impact on stock market performance. |
CP ⟹ SMP |
Accepted |
Rejected |
|
H3 |
Interest rate has a negative impact on stock market performance. |
IR ⟹ SMP |
Accepted |
Rejected |
The impact of economic growth on stock market performance: The finding reveals that economic growth (EG) is positively (4.0672) correlated to stock market turnover (TR) in the short run at the 5% significance level. It can be deduced that when the economy grows well, it can create more opportunities for investors to increase their income and then actively invest in stock. As a result, this stimulates the increase in equity market. This was clearly shown in the period from 2008 to the beginning of 2009 when Vietnam economy experienced many predicaments (specifically a considerable decrease in economic growth) which caused the fall in stock market turnover (Fig.6). This finding is in line with what have been found by Shahbaz et al. (2008), Enisan and Olufisayo (2009), Marques et al. (2013). However, earlier scholars measured the performance of stock market by stock index. This study greatly succeeds in providing a novel perspective on stock market return by analyzing stock market turnover.
The impact of consumer price index on stock market performance: Stock index (SI) is negatively influenced by consumer price index (CP) in the long run (-2.4811) at the 10% level of significance and in the short run (-0.4374) at the 5% of significance level. Therefore, it can be stated that a highly increased consumer price index can cause problems to business operation of firms, make stock market less attractive to investors and consequently decrease the performance of stock market. This is consistent with findings of Akbar et al. (2011), Naik and Padhi (2012).
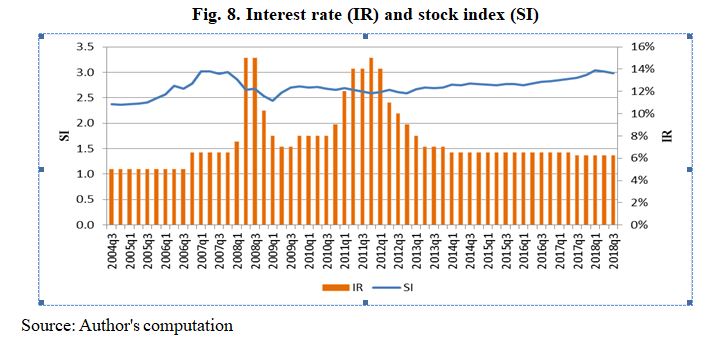
The impact of interest rate on stock market performance: Interest rate (IR) has a significant impact on stock index (SI) in the short run at the 1% level of significance. Nevertheless, the influence changes over time. This result corroborates what reported by Laopodis (2011) và Peiró (2016). In recent years, Vietnam economy fluctuates unpredictably, so the central bank developed flexible monetary policies to suit it developments. This thus leads to continual adjustments in interest rate (especially during seriously difficult periods) and then causes unstable short-run effects on stock market return.
By this paper, the author reports the statistically significant impact of the macroeconomy on stock market performance in Vietnam, a developing country with a young but potential equity market. Beside traditionally using stock index as an indicator of stock market performance, this study has a novelty with a new perspective by including stock market turnover as a measure. The results interestingly reveal the negative nexus between stock market performance and consumer price index in the short run and long run. Also, it can be identified that the performance of stock market is significantly influenced by economic growth and interest rate. Based on these, it is advisable that policymakers should develop suitable policies to stabilize the macroeconomy and aim to the development of stock market performance. For investors, it is necessary to research and forecast macroeconomic situations thoroughly to make an effective investment decision. Because these are empirical evidence in an emerging stock market, they have practical and meaningful value to emerging markets in developing countries like Vietnam. Despite achieving its goals, the study has its limitations, e.g. the link between the global macroeconomy and stock market performance has not been analyzed. This may be an interesting trend for future studies.
Akbar, M., Ali, S., & Khan F.M. (2011). The relationship of stock prices and macroeconomic variables revisited: Evidence from Karachi stock exchange. African Journal of Business Management, 6(4), 1315-1322.
Alam, N. (2017). Analysis of the impact of select macroeconomic variables on the Indian stock market: A heteroscedastic cointegration approach. Business and Economic Horizons, 13(1), 119-127.
Al-Shami, H.A.A., & Ibrahim, Y. (2013). The effects of macro-economic indicators on stock returns: Evidence from Kuwait stock market. American Journal of Economics, 3(5C), 57-66.
Asmy, M., Rohilina, W., Hassama, A., & Fouad, M. (2010). Effects of macroeconomic variables on stock prices in Malaysia: An approach of error correction model.  The Global Journal of Finance and Economics, 7(2), 149-168.
Awojobi, O. (2013). Does trade openness and financial liberalization foster growth: An empirical study of Greek economy. International Journal of Social Economics, 40, 537-555.
Bai, Y., & Green,  C.J. (2011).  Determinants of cross-sectional stock return variations in emerging markets. Empirical Economics, 41(1), 81-102.
Bampinas, G., & Panagiotidis, T. (2016). Hedging inflation with individual US stocks: A long-run portfolio analysis. North American Journal of Economics and Finance, 37, 374-392.
Bouchouicha, R., & Ftiti, Z. (2012). Real estate markets and the macroeconomy: A dynamic coherence framework. Economic Modelling, 29(5), 1820-1829.
Brown, R.L., Durbin, J., & Evans, J.M., (1975). Techniques for Testing the Constancy of Regression Relationships Over Time. Journal of the Royal Statistical Society, 37(2), 149-192.
Camilleri, S.J., Scicluna, N., & Bai, Y. (2019). Do Stock Markets Lead or Lag Macroeconomic Variables? Evidence from Se-lect European Countries. North American Journal of Economics & Finance, 48, 170-186.
Chen, N.-F., Roll, R., & Ross, A.S. (1986). Economic Forces and the Stock Market. Journal of Business, 59(3), 383-403.
Dickey, D., & Fuller, W. (1979). Distribution of the Estimators for Autoregressive Time Series with Unit Root. Journal of the American Statistical Association, 74, 427-432.
Enisan, A.A., & Olufisayo, A.O. (2009). Stock market development and economic growth: Evidence from seven sub-Sahara African countries. Journal of Economics and Business, 61(2), 162-171.
Fama, E.F., & French, K.R. (1989). Business conditions and expected returns on stocks and bonds. Journal of Financial Economics, 25, 23-49.
Gordon, M.J. (1962). The investment, financing, and valuation of the corporation. Homewood, IL: Richard D. Irwin, Inc.
Humpe, A., & Macmillian, P. (2009). Can macroeconomic variables explain long term stock market movements? A comparison of the US and Japan. Applied Financial Economics, 19(2), 111-119.
Hussain, A., Rafique, M., Khalil, A., & Nawaz, M. (2013). Macroeconomic determinants of stock price variations: an economic analysis of KSE-100 index. Pakistan Journal of Humanities and Social Sciences, 1(1), 28-46.
Iacoviello, M. (2005). House prices, borrowing constraints and monetary policy in the business cycle. American Economic Review, 95, 739-764.
Iddrisu, S., Harvey, S.K., & Amidu, M. (2017). The impact of monetary policy on stock market performance: Evidence from twelve (12) African countries. Research in International Business and Finance, 42, 1372-1382.
King, R.G., & Watson, M.W. (1996). Money, Prices, Interest rates and the business cycle. The Review of Economics and Statistics, 78, 35-53.
Laopodis, N.T. (2011). Equity prices and macroeconomic fundamentals: International evidence. Journal of International Financial Markets, Institutions and Money, 21(2), 247-276.
Lawal, A.I., Somoye, R.O., Babajide, A.A., & Nwanji, T.I. (2018). The effect of fiscal and monetary policies interaction on stock market performance: Evidence from Nigeria. Future Business Journal, 4(2018), 16-33.
Liang, Q., & Teng, J.Z. (2006). Financial development and economic growth: Evidence from China. China Economic Review, 17(4), 395-411.
Lin, P., & Fuerst, F. (2014). The integration of direct real estate and stock markets in Asia. Applied Economics, 46(12), 1323-1334.
Lin, T., & Lin, Z. (2011). Are stock and real estate markets integrated? An empirical study of six Asian economies. Pacific-Basin Finance Journal, 19, 571-585.
Marques, L.M., Fuinhas, J.A., & Marques, A.C. (2013). Does the stock market cause economic growth? Portuguese evidence of economic regime change. Economic Modelling, 32, 316-324.
Naik, P.K., & Padhi, P. (2012).  Interaction of macroeconomic factors and stock market index: Empirical evidence from Indian data. Unpublished Working Paper. 1-23. http://dx.doi.org/10.2139/ssrn.2150208
Ndako, U.B. (2010). Stock markets, banks and economic growth: time series evidence from South Africa. The African Finance Journal, 12(2), 72-92.
Ouma, W.N., & Muriu, P. (2014). The impact of macroeconomic variables on stock market returns in Kenya. International Journal of Business and Commerce, 3(11), 1-31.
Pahlavani, M., Wilson, E., & Worthington, A. (2005). Trade-GDP Nexus in Iran: An Application of the Autoregressive Distributed Lag (ARDL) Model. American Journal of Applied Sciences, 2(7), 1158-1165.
Pan, L., & Mishra, V. (2017). Stock market development and economic growth: Empirical evidence from China. Economic Modelling, 68, 661-673.
Peiró, A. (2016). Stock prices and macroeconomic factors: Some European evidence. International Review of Economics and Finance, 41(C), 287-294.
Pesaran, M.H., Shin, Y., & Smith, R. (2001). Bounds testing approaches to the analysis of level relationship. Journal of Applied Econometrics, 16(3), 289-326.
Ratanapakorn, O., & Sharma, S.C. (2007). Dynamic analysis between the US stock returns and the macroeconomic variables. Applied Financial Economics, 17(5), 369-377.
Riyazahmed, K., & Saravanaraj, M.G. (2015). A Study on Factors Influencing Buying Behavior of Securities in Indian Stock Markets. Journal of Marketing, 7(1), 1-10.
Sargent, T.J. (1999). A primer on monetary and fiscal policy. Journal of Banking & Finance, 23(10), 1463-1482.
Shahbaz, M., Ahmed, N., & Ali, L. (2008). Stock market development and economic growth: ARDL causality in Pakistan. International Research Journal of Finance and Economics, 14(1), 182-195.
Tease, W. (1993). The stock market and investment. OECD Economic Studies, 20, 41-63.
Tursoy, T., Faisal, F. (2016). Causality between stock price and GDP in Turkey: An ARDL Bounds Testing Approach. Romanian Statistical Review, 4(2016), 3-19.

