Author
|
Dr. Muhammad Ishtiaq Assistant Professor Lyallpur Business School Government College University, Faisalabad E-mail:- mishtiaq@gcuf.edu.pk |
Dr. Muhammad Shahid Tufail Assistant Professor Lyallpur Business School Government College University, Faisalabad. E-mail:- mshahidtufail@gcuf.edu.pk |
Dr. Saqib Muneer Department of Economics and Finance University of Hail, KSA E-mail:- saqibmuneer85@gmail.com0 |
Muhammad Bilal Sarwar MPhil (Commerce) Scholar College of Commerce Government College University, Faisalabad |
Asset pricing models are attempt to pricing the different risks associated with the return on securities or other financial assets. Recently, Fama and French (2015) develop a five-factor asset pricing model which covers the limitations of Fama-French (1993) three factor model and Capital asset pricing model in terms of capturing the return behavior of portfolios related to the four firm characteristics: Market Capitalization, Book-to-Market ratio, Profitability and Investment. In this study, researcher applied both Fama-French three factor and five factor models in the Pakistan stock market which is an emerging stock market to suggest best model to pricing the Pakistani stocks. The study based on sample of KSE-100 index companies for the period 2007 to 2015. The regression results declared that Fama-French five factor model is better than three factor model to capture the portfolio return patterns related to the size, value, profitability and investment in the Pakistan stock market. The findings reveals that the five factors model capture the risk levels associated with firms’ characteristics and market portfolio returns fluctuations in pricing the stocks. Therefore, this model is useful to apply in security selection for portfolio formation, pricing the financial assets, to check the performance of the fund management industry and to calculate the required rate of return on investment.
Keywords: Asset Pricing Model, Fama-French Five Factor Model, Fama-French Three Factor Model, Capital Asset Pricing Model, Market Capitalization, Book Equity-to-Market Equity ratio, Profitability, Investment, Pakistan Stock Market.
Investment in the stock market leads to investors to think about the factors which possibly influence the prices of stock and the returns. The determinants of stock returns always a most debatable topic in the financial literature and asset pricing model is a model which explains the relationship between return on an asset and risk associated with return. In this area, the Capital asset pricing model (CAPM) developed independently by Sharpe (1964) ; Lintner (1965) and Mossin (1966) is the first model based on the portfolio selection theory presented by Markowitz (1952) .Recently, a five factor model of Fama and French (2015) was emerged to pricing stocks which overcome the limitations of earlier models in this area.
The CAPM takes the effect of systematic risk which related to the market risk in his model. The systematic risk in CAPM is measured by the beta (β). The β is characterized as the commitment of an asset to the risk of a portfolio, which can be measured by its co-variance with the market return divided by the variance of the market return. The CAPM stated that the expected return on security is the function of its market β, that is, higher or lower the security β, the higher or lower the expected return on security. Therefore, the investor should get a return on security keeping the view of time value of money concept (i.e. Return on risk free security) and taking extra risk (i.e. Risk premium) by investing in risky security.
Although CAPM used frequently during 1970’s, but many researchers challenged this model as many other variables are uncovered in this model. These uncovered variables are called anomalies (Fama & French, 2008). In 1980’s and 1990’s many researchers found some anomalies which could not be anticipated by CAPM and provide evidence against the capability of the CAPM to explain the stock returns. These includes the Size anomaly evidence by the Banz (1981) ; Reinganum (1981) ; Keim (1983) , Book Equity to Market Equity effect (BE-to-ME) evidence by Stattman (1980) ; Rosenberg; Reid and Lanstien (1985 ). The above researchers’ findings show that there are some other asset characteristics other than β that have explanatory power over expected returns. Fama and French (1992) By taking the view of the above researchers’ findings augment the CAPM with other variables: size, leverage, book equity to market equity ratio and earning price ratio. In their study they concluded that β of the CAPM did not establish the link among size of the stocks and their stock return, BE-to-ME ratio of the stocks and their stock returns. Fama and French (1993) formed asset pricing model in view of three factors (F-F3FM) which incorporate the market risk factor together with size and value factors. The size factor evaluates that the stocks with a small level of market capitalization have a tendency to perform superior to the returns offered by firms having large market capitalization. The value factor analyze that the firms with higher BE-to-ME ratio give more average returns over low BE-to-ME firms.
Since the development of the CAPM, many asset pricing models have been developed. The main driving force behind the development of various pricing models is the failure of asset pricing models to fully explain the return patterns. So, this motivation leads to researchers to augment the previous asset pricing models with other explanatory variables, in turn, these variables capture the returns on portfolio and provide evidence to use in the asset pricing model to explain the full variation in return on single security or portfolio. Carhart (1997) expanded the F-F3FM with momentum factor. Novy-Marx (2013) identified another variable, that is, operating profitably which strongly related to the average stock returns. The weak but statically consistent relation between investment and average return concluded by Aharoni et al. (2013) . Further evidence on investment factor evidenced by Titman, Wei, and Xie (2004) ; Cooper, Gulen, and Schill (2008) ; Gray and Johnson (2011) . Fama and French (2008) showed negative relationship between profitability and stock return for US stock market. Fama and French (2015) from the analysis of above researcher’s findings and with help of dividend discount model proposed a five factor model (F-F5FM) which included profitability and investment as additional risk factors to F-F3FM. They concluded that the F-F5FM capture the greater variations in average stock returns than F-F3FM.
From the analysis of the available literature on the various asset pricing models, Researcher evaluate that most of the work has been done in developed markets. The Pakistan stock market is an Emerging market (Hassan & Javed, 2011) and exiting studies on CAPM and F-F3FM in the Pakistan stock market context are done by the Iqbal and Brooks (2007) ; Mirza and Shahid (2008) ; Hassan and Javed (2011) ; Hamid, Hanif, and ul Malook (2012) ; Abbas, Khan, Aziz, and Sumrani (2014) and Shah, Ghafoor, and Khan (2014) .From the available studies in Pakistan stock market context, it’s worthwhile to study the Pakistan stock market with latest version of asset of pricing model of Fama-French to overcome the problem of asset pricing in the emerging market (Muneer et al., 2017).
From the above discussion, Researcher investigates the following research questions:
(1) Is the Fama-French five factor model has sufficient Explanatory power towards explaining the cross-sectional variation in testable portfolio returns related to the Size, Book Equity-to-Market Equity, Profitability and investment level of stocks with sufficient significance in the Pakistan Stock Market?
(2) Is the Fama-French five factor model has any improvement over Fama-French three factor model in explaining the excess portfolio returns in the Pakistan Stock Market?
(3) What is the role of profitability and investment premiums in capturing the cross-sectional variation in portfolio returns sorted on profitability level and investment level of the stocks?
(4) Is the Value premium risk factor turn out to be insignificant with the addition of profitability and investment factors in the Fama-French three factor model?
The current study is contributing to the literature on asset pricing models and Provide replication of newly formed F-F5FM which was tested in US stock market but no one attempt to test in the emerging market like Pakistani stock market. In this study, the performance of two asset pricing models is tested; one is F-F3FM and second is F-F5FM.Both F-F3FM and F-F5FM are compared for purposes to search better asset pricing model, to answer the research questions of the study and fulfill the objective of the study. To accomplish these tasks, the researcher used KSE-100 index as a sample which constitute on 100 companies from all sectors on the basis of their Market Capitalization.
The findings of the study reveal that the coefficient of excess market portfolio return β still has greater importance because it found as highly positively significant factor in all tests. The size premium well captured the return variation of the portfolios related to the size level of the stocks. Value factor also captures variation related to BE-to-ME ratio of the stocks. The addition of two new factors is also logical because they are both significantly capturing portfolio return variations related profitability level and investment level of the stocks, therefore, the addition of two new factors to three factor model increase the significance of the five factor model. The inclusion of two new factors to three factor becomes the value factor is insignificant and this result is similar to the Fama and French (2015) study who also found it insignificant.
The next portion of the study is organized as follows: 2 represents review of literature on empirical testing of F-F3FM, F-F5FM and evidence related to the inclusion of two new factors in F-F3FM. 3 Discuss the Data and sources of data, Population and Sample, Explanation of variables and Econometric Methodology. 4 Final results and discussion on results and finally 5 report limitation of the study and future suggestion, conclusion of the study.
A considerable quantity of studies has been performed to test the validity of the CAPM in explaining the variation in rate of return. But, it became later realized that the expected returns are probably sensitive to other characteristics. On this regard Merton (1973) and Ross (1976) developed multifactor models: named as Inter-temporal CAPM and the Arbitrage Pricing Theory (APT), respectively. After that, many other variables had been detected by the researchers and concluded that these variables have the robust explanatory strength to provide an explanation for the variation inside the stock return. Basu (1977) found that stocks with lower price to earnings (P/E) ratios provided better risk adjusted returns than stocks with higher P/E ratios. Banz (1981) found that shares of smaller size companies furnished better risk adjusted returns than shares of larger size companies. Rosenberg et al. (1985) studied BE-to-ME ratio in relation to the average return on US stocks and showed a direct relation between BE-to-ME ratio and stock return. These limitations of the CAPM and above studies of the researchers motivated the Fama and French to build an alternative approach to predict the stock returns.
Fama and French (1992) used a sample of nonfinancial firms drawn from 3 predominant US financial markets (NYSE, AMEX and NASDAQ), over the length from 1963 to 1990. They test the capability of the market beta coefficient (β), size (book equity), Earning to price ratio (E/P), leverage and BE-to-ME ratio to explain the variations in the cross-section of stock returns. They constructed portfolios on the basis of size and BE-to-ME ratio and the performance of the portfolios were tested by the Fama-Macbeth regression model. The regression results reported significant positive BE-to-ME effect, significant negative size effect on equity returns and found no relationship between market beta and equity returns.
Fama and French (1993) developed the three factors on basis of their previous study which was the extension of the CAPM. The three factors included in the model were (1) Excess market portfolio returns (2) Size premium (3) Value premium. Fama and French (1992, 1993) showed that traditional CAPM of Sharpe (1964) , has inability to enlighten the cross-sectional variation in expected returns associated with size and BE-to-ME ratio of the stocks. The time series regression of three factor model presented as:
In above equation, is the return on security or portfolio i for time period t in excess of risk free rate, is the risk free rate, is the return on the market portfolio, represent the market risk premium, is the size premium and is the value premium. bi , hi and si represent the slopes in the time series regression. Represent the intercept of regression. Symbolize the residual of the regression.
The size effect, that is, small size stocks given more return over big size stocks and value effect, that is, high BE-to-ME stocks given more returns over Low BE-to-ME stocks which were found by Fama and French (1993) . The empirically test of F-F3FM in different developed as well as in emerging stock markets were also confirmed the size effect and value effect by Dennis, Perfect, Snow, and Wiles (1995) ; Faff (2001) in the Australian stock market; Ajili (2002) in the France stock market; Gaunt (2004) in Australian stock market; Bahl (2006) in the Indian stock market; Bundoo (2008) in the African stock market; Czapkiewicz and Skalna (2010) in the Poland stock market; Al-Mwalla and Karasneh (2011) in the Amman stock market; Eraslan (2013 in the Istanbol stock exchange and Le (2015) in the Vietnamese Stock Market. The F-F3FM also applied in the emerging market like the Pakistan Stock Exchange by Iqbal and Brooks (2007) ; Mirza and Shahid (2008) ; Hassan and Javed (2011) ; Hamid, Hanif, and ul Malook (2012) ; Abbas et al. (2014) and Shah, Ghafoor, and Khan (2014) , these research studies were also confirmed the size effect as well as value effect.
Although F-F3FM proved as the superior Asset pricing model than CAPM by above studies, however, many researchers augment the F-F3FM with other variables and found relationship of some other variables with stock return. Carhart (1997) expanded F-F3FM with momentum factor and found that lagged stock return effect the stock return. Titman et al. (2004) Identified that companies that increased capital investment subsequently tend to be gained negative returns. They observed that this negative association between investment and return are mostly found in those firms which have lower debt ratio, higher cash flows and have more discretion to invest. Further evidence on this negative relationship between investment factor and subsequently stock return were evidenced by Cooper et al.(2008) in the US stock market; Gray and Johnson (2011) in the Australian stock market; Watanabe, Xu, Yao, and Yu (2013) in developed markets; Wang, Liu, Lee, and Wang (2015) in the Chinese stock market. An alternative 3-factor model proposed by Chen, Novy-Marx, and Zhang (2011) which used market risk premium, investment and profitability factors to explain the cross-sectional variations in the stock returns, they found indirect relationship between investment factor and stock return while controlling profitability variable and direct relationship between profitability and stock return while controlling the investment factor. Novy-Marx (2013) in support of Titman et al. (2004) argued that F-F3FM still fails to fully explain the U.S stock returns patterns and uncovers a positive relation between profitable firms and expected returns. These evidences suggest that variation in return on portfolio or single security is related to profitability and investment factor and the variation caused by these two factors is not explained by the F-F3FM.
Besides the above mentioned research studies, Fama and French (2015) added profitability and investment factors based on the manipulation of dividend discount model and together with the Valuation Theory of Miller and Modigliani (1961). Valuation Theory explained the relationship of expected stock returns with three variables namely: BE-to-ME ratio, Expected Profitability and Expected Investment as (1) BE-to-ME ratio has direct relationship with expected stock returns, that is, stock with higher BE/ME ratio tends to be showed higher expected returns, other things being Constant, (2) Profitability also has direct relationship with expected stock returns, that is, Firms with higher Profitability tends to be showed higher expected returns, other things being Constant, (3) Growth in investment has indirect relationship with expected stock returns, that is, Firms with higher Investment tends to be showed lower expected returns, other things being Constant.
On the basis of the above arguments, Fama-French add profitability and investment factors in their previous F-F3FM. The time series regression equation of F-F5FM presented as:
In above equation, represents the risk premium related to profitability level of stocks, indicates the risk premium related to investment level of the stocks.
The results of Fama and French (2015) study showed the presence of the patterns in average returns associated with size, BE-to-ME, profitability and investment levels of the stocks. They demonstrated that F-F5FM produce better results than F-F3FM in capturing the variations in the portfolio returns in terms of U.S stock market, as the model explained the cross-section variation ranging from 71% to 94% of the expected returns of the portfolios constructed on the basis of size, BE-to-ME ratio, profitability and investment. However, the addition of new factors (profitability and investment) in F-F3FM the value factor becomes redundant. Along with they also point out that there are many evidences exist in favor of the value factor, therefore, they imply that their results might be sample or region specific. So, there is need to conduct this study in other regions to support the newly formed five factor model.
3.1 DATA AND SAMPLE DESCRIPTION
The undertaken study used the monthly stock returns from the period January, 2009 to June, 2015 of the Companies listed in the Pakistan Stock Exchange. The data regarding the accounting variables (i.e. Book Equity, Profitability and Investment) of the Companies are ranged from December, 2008 to December, 2014.For the sample concern, Researcher chooses KSE 100-index out of which 82companies are slected as per the following criteria:
For investors to know about the accounting data before the portfolio formation date, all the companies included in the sample must be listed at least 36 months prior to the portfolio formation date and must be have trading record during the study period.(Chiah et al., 2015). In the sample, stocks which have negative book value of equity are also excluded.(Chiah et al.,2015; Singh & Yadav, 2015).The Companies which have missing data regarding the stock pricing and other accounting variables during the study period are also excluded.
3.2 VARIABLES USED FOR THE SORTING PURPOSE
The variables related to the study are defined and calculate in accordance with the Fama and French (1993,2015) methodology. Every year, at the end of financial year of the companies, that is, 30 th June, 30th September, November 30thand December 31st. The stocks are sorted on Market Capitalization, Book equity to Market Equity, Profitability and Investment variables and then allocated to the Portfolios. The details regarding the computation of these variables are here as under:
3.2.1 Market Capitalization (ME) .Market Capitalization referred to Size of the Stock. It’s calculated by multiplying the No. of shares outstanding and the market price per share ( Singh and Yadav, 2015) . It’s calculated on the portfolio formation date, that is, 30th June of year t.
3.2.2 Book Equity to Market Equity Ratio (BE-to-ME) .It referred to the value of the stock. This ratio is calculated on the financial year end of the companies of year t-1, that is, both variables are taken on financial year end of the companies. Book equity used in this ratio is total shareholders’ equity less the preferred shareholders’ equity( Singh and Yadav, 2015) .
3.2.3 Profitability(OP) . Fama and French (2015) define the profitability as “Total annual revenue less cost of sold, interest expense, general, selling and administrative expenses and then divided by the BE”.
3.2.4 Investment (Inv) . Asset growth (i.e. proxy for investment variable) is defined as“Change in total assets of the company from financial year end of year t-2 to financial year end of yeart-1, divided by total assets at the financial year end of year t-2”.(Cooper et al., 2008; Fama & French, 2008; Gray & Johnson, 2011 and Fama & French, 2015).
3.3 INDEPENDENT VARIABLES (CONSTRUCTION OF RISK FACTORS
The independent variables are computed by following the methodology of Fama and French (1993, 2015). First , all the companies included in the sample are at their financial year end of year t-1 are ranked according the above calculated accounting variables (BE-to-ME ratio, Profitability and Investment) from smallest to largest value for concerned variables. Second , the companies are also sorted on the basis of their market capitalization which is calculated on June 30th of year t. These double sorting of the companies provide the different categories of stocks under the Size, BE-to-ME ratio, profitability and Investment variables which is discuss in computation of the Independent variables. Third , now the portfolios are formed on the basis of the Size, BE-to-ME ratio, profitability and Investment variables and calculate the stock returns of stocks included in the portfolios. The first sorting is Size and BE-to-ME ratio, Second is Size and Profitability and third is Size and Investment. The details regarding the No. of stocks under each portfolio in each year are reported in table 3.4 .One thing is noticeable here that there is a time lag of at least six months between the end of financial year (i.e. June 30th, September 30th, November 30th and December 31 st of calendar year t-1) and the time of portfolio creation (i.e. June 30th of calendar year t). A minimum lag of six months is maintained to ensure that the accounting information is known to the investors before the portfolio formation takes place. This procedure avoids the look-ahead bias, and is also in line with the method used by Fama and French (1993, 2015).The details regarding the construction of these variables here as under:
3.3.1 Excess Market Portfolio Return (EMPR) .EMPR calculated as the difference between market returns (MKTR)and risk free rate (RFR). The returns on KSE-100 index are taken as proxy for market returns and the Annual yield on Treasury bill (adjusted in monthly return) used as a proxy for the risk free rate.
The market return (MKTR) for the month t is calculated by taking the natural logarithm of closing current month value of KSE-100 index (I t)and closing value of previous month (It-1).
3.3.2 Size Premium (SSMBS).Size Premium is the average return of small size portfolio minus average return of big size Portfolio on the basis of their market capitalization (ME). As for concern of the construction of this factor, market capitalizations of the stocks included in the sample are sorted from the smallest to largest value. Using the median value of market capitalization the stocks above the median market capitalization are Small Size Stocks and below the median market capitalization are Big Size Stocks. This size sorting of stocks produce two portfolios that is, Small Size portfolio (SS) and Big Size portfolio (BS).Stocks are also ranked independently according to their BE-to-ME ratio from smallest to highest BE-to-ME ratio, Based on the breakpoints, top 30 % are Low BE-to-ME stocks, middle 40 % are neutral stocks and bottom 30 % are High stocks. This BE-to-ME ratio sorting of the stocks produce three portfolios named as Low Ratio, Neutral Ratio and High Ratio (LR, NR, HR) respectively .Six portfolios are obtained by the intersection of two size (SS, BS) and three value portfolios (LR, NR, HR). These six portfolios are SSLR, SSNR, SSHR, BSLR, BSNR, BSHR are presented in table 3.1. For instance, SSLR portfolio represent the stocks which has small size and also has low BE/ME ratio.
(Table 3.1 Inserted here)
The SSMBS factor reflects the size effect of stocks on the portfolio returns sorted on size and BE-to-ME ratio variables means that small size stocks are considered by investors are more risky than big size stocks and they expect that small size stock give return premium over big size stocks because the small size companies are affected by the various risk components in greater extent than big size companies, for diversification point of view, they are less diversified than big size companies and also financial flexibility of small size is less than big size companies (Mirza & Shahid, 2008). Now, SSMBS is defined as the average of returns of three small size portfolios (SSLR, SSNR, and SSHR) minus the average of returns of three big size portfolios (BSLR, BSNR, and BSHR).
The average size premium factor consistent with Fama and French (2015) is computed by taking the average of size premium factors sorted on BE-to-ME, profitability and investment variables.
3.3.3 Value Premium (HRMLR) . HRMLR factor reflects the value effect of the stocks on portfolio returns sorted on the basis of size and BE/ME ratio variable. This imply that high BE-to-ME portfolios are considered by the investors are more risky than low BE-to-ME portfolios and expect that high BE-to-ME portfolios give return premium over low BE-to-ME portfolios because a higher ratio of BE-to-ME indicates that market value of the stock is less then book value of the stock, that is, for the market value point of view, market does not give higher value on that stocks. The market gives lower value because of the low profitability of such stocks or investors’ predictions about the future performance of the stocks, that is, the stocks which have low value can be exposed to financial risk as well as business risk (Mirza & Shahid, 2008). Now, HRMLR is defined as the average of returns on two high BE/ME ratio portfolios (SSHR and BSHR) minus the average of returns on two low BE/ME ratio portfolios (SSLR and BSLR).
3.3.4 Profitability Premium (HPMLP) .Similar steps are followed for defining HPMLP, except that the second sorting is on basis of profitability variable, that is, top 30% stocks are represent the Low profitable, middle 40% are Neutral profitable and below 30% are represent the High profitable .HPMLP reflects the profitability level of stocks in the portfolio returns sorted on size and profitability variables. The higher profitable portfolio consist of companies that will be seeing by the investors are more prospective and their securities are more demanding in perspective of investment in capital market so, they give higher returns over Low profitable portfolio. Six portfolios are obtained by the intersection of two size (SS, BS) and three profitability portfolios (LP, NP, HP). These six portfolios are SSLP, SSNP, SSHP, BSLP, BSNP, BSHP are presented in table 3.2.
(Table 3.2 Inserted here)
Now HPMLP is defined as the average of returns on two High profitable portfolios (SSHP and BSHP) minus the average of returns on two Low profitable portfolios (SSLP and BSLP).
The SSMBS factor is computed as when stocks are sorted on size and profitability variables.
3.3.5 Investment Premium (LIMHI) .Investment factor (LIMHI) also define in same fashion as Profitability factor (HPMLP) except that the second sorting is on basis of investment, that is, top 30% are Low investment Stocks, middle 40% are Neutral investment stocks and below 30% are high investment stocks. LIMHI reflects the effect of investment level of the stocks in the portfolio returns sorted on size and investment variables. Six portfolios are obtained by the intersection of two size (SS, BS) and three investment portfolios (LI, NI, HI). These six portfolios are SSLI, SSNI, SSHI, BSLI, BSNI, BSHI are presented in table 3.3.
(Table 3.3 inserted here)
Now, LIMHI is defined as the average of returns on two Low investment portfolios (SSLI and BSLI) minus the average of returns on two High investment portfolios (SSHI and BSHI).
The SSMBS factor is computed as when stocks are sorted on size and investment variables.
(Table 3.4 Inserted here)
3.4DEPENDENT VARIABLE (TESTABLE PORTFOLIOS)
Excess Portfolio Return(EPRi) is the difference between Portfolio Return and Risk Free Rate.Lakonishok, Shliefer and Vishny (1994) suggested that Individual Portfolio Return is calculated as the sum of equal weighted return of each individual stock within its categorization over timet. Fama and French (1996) document that the three factor model does a better job in explaining equally weighted portfolios as compared with value-weighted portfolios(Connor & Sehgal, 2001).The monthly rate of return for each stock is calculated under each portfolio reported in table 3.4. The monthly rate of return for each stock in the sample is calculated as follows(Abbas et al., 2014).
In above equation, SRitis the rate of return of stock i for the month t, Ln is a natural logarithm, Pt is the month end closing price of the stock i for the month t. Pt-1 is the month end closing price of the stock i for the month t-1. The natural log has been used by the researchers as it helps to deal with extremely large and small values. Now, each portfolio return is calculate by assigning the equal weights to stock returns under each portfolio and then minus the risk free rate from it to get excess portfolio return.
Where, is return of portfolio i for the month t, w is the weight assign to the stock return, and is the return on stock i for month t.
The portfolios which are testable for pricing purpose are dependent variables in this study. Testable portfolios are constructed in the same fashion as researcher did in construction of the risk factors. Six portfolios sorted on the basis of the size and BE-to-ME ratio, size and Profitability, size and Investment are regressed on the risk factors include in the three factors model, that is, Market risk premium (EMPR), size premium (SSMBS) and value premium (HRMLR) and also on the risk factors include in five factors model with addition of the two new risk factors, that is, Profitability Premium (HPMLP) and Investment Premium (LIMHI).
(Table 3.5 Inserted here)
3.5 ECONOMETRIC METHODOLOGY
3.5.1 Econometric Model
Time series regression model is used to check the validity of the asset pricing model, that is, the results of the asset pricing model reflect the risk and return relationship and significance of risk factors in capturing the cross-section return variation in testable portfolios. The model is hold true when it pricing risk factors in portfolio return, that is, the risky portfolio gives more return over less risky portfolio. The time series regression equations for F-F3FM and F-F5FM are shown as, respectively:
In above equations; is Excess return of Portfolio i over the Risk free Rate for month t, isExcess Market Portfolio return for the month t , is Size Premium for the month t , is Value Premium for month t, is Profitability Premium for month t, is Investment Premium for month t. is Intercept of the regression equation. are Slopes of the Independent Variables. is Residual term.
3.6HYPOTHESIS
Following hypothesis are formed on the basis of review of the risk-return relationship for each independent variable. The hypotheses arealso formed by keeping the view of significance of risk factor and comparison of the slopes of the factors for testable portfolios:
H1: EMPR factor significantly capture the cross-sectional variation in all portfolio returns.
H2: The SSMBS factor related to size of the stock significantly capture the cross-sectional variation in portfolio returns sorted on size variable.
H3: The coefficient of SSMBS factor s has higher value for small size portfolios than big size portfolios.
H4: The HRMLR factor related to BE-to-ME ratio of the stock significantly capture the cross-sectional variation in portfolio returns sorted on BE-to-ME ratio.
H5: The coefficient of HRMLR factor h has higher value for value portfolio than growth portfolio.
H6: The HPMLP factor related to Profitability of the stock significantly capture the cross-sectional variation in portfolio returns sorted on Profitability variable.
H7: The coefficient of HPMLP factor p has higher value for higher profitable portfolio than low profitable portfolio.
H8: The LIMHI factor related to Investment level of the stock significantly capture the cross-sectional variation in portfolio returns sorted on Investment variable.
H9: The coefficient of LIMHI factor I has higher value for low investment portfolio than high Investment portfolio.
Following hypothesis based on explanatory power of the asset pricing models, that is, which model has more explanatory power in terms of capture the cross-sectional variation in portfolio returns sorted on size-BE-to-ME ratio, Size-Profitability variables and Size-Investment variables? As the review on Empirical testing of F-F5FM in different stock markets suggest that F-F5FM performed well over F-F3FM.
H10: The F-F5FM has more explanatory power than F-F3FM.
The regression results and their analysis reported in this section but before applying to estimates parameters of the regression equation, there is need to check the validity of time series data to avoid from spurious results of proposed asset pricing model.
4.1 STATIONARY TEST
Al-Mwalla and Karasneh (2011) provided arguments about the results of non-stationary time series that the results which we have obtained from non-stationary time series may be spurious which means that the relationship between two variables may not be exist in actual scenario but statically the results confirmed the relationship between two variables. Augmented Dickey--Fuller test (ADF) is used to check the stationary of the all the time series of variables, ADF test statistics are reported in table 4.1.
(Table 4.1 Inserted here)
The above results show that all the time series of excess portfolio returns are stationary at its level, because in each case null hypothesis is rejected in favor of accepting the alternative hypothesis. ADF test for time series of independent variables also show that all the time series are stationary at its level. These results are confirmed with Al-Mwalla and Karasneh (2011) and also they suggested Ordinary Least Square method (OLS) to estimate the regression coefficients when all variables have stationary time series.
4.2 DESCRIPTIVE STATISTICS
Descriptive Statistics of monthly excess portfolio returns in table 4.2 sorted on size and BE-to-ME ratio show that portfolio returns increase from big size portfolios (BSLR, BSNR, BSHR) to small size portfolios (SSLR,SSNR,SSHR) across each level of BE-to-ME ratio. The increasing pattern of portfolio returns sorted on size variable depicts that small size portfolios have more returns than big size portfolios which indicates the size effect in the Pakistan Stock market, that is, investing in small size stocks gives return premium over big size stocks. As the standard deviation measure variability of the portfolio returns, more the variability in return patterns more the portfolio is risky. The standard deviation is higher for small size portfolios (7.04 %. 5.92 %, 8.54 %) than big size portfolios (4.85 %, 5.52 %, and 7.30 %). The value effect also prominent for BE-to-ME sorted portfolios in the Pakistan stock Market which shows that high BE-to-ME ratio portfolios (SSHR, BSHR) have more returns than low BE-to-ME ratio portfolios (SSLR, BSLR). These results regarding the BE-to-ME sorted portfolios are also consistent with the risk and return relationship, as the standard deviation of high BE-to-ME ratio portfolios (8.54 % and 7.03 %) higher than the standard deviation of low BE-to-ME ratio portfolios (7.04 % and 4.58 %). The highest returns offer by the SSHR portfolio among the size and BE-to-ME ratio sorted portfolios also have highest standard deviation. The returns patterns found for size and BE-to-ME ratio portfolios are consistent with Singh and Yadav (2015) ; Fama and French (2015) .
Moreover, the portfolios sorted on size and profitability of the stocks shows that low profitable portfolios (SSLP, BSLP) have more returns than high profitable portfolios (SSHP, BSHP). So, for sample stocks, an indirect relationship is observing between profitability of the stocks and their stocks returns. Singh and Yadav (2015) reported the inverse relationship between profitably and stock returns for the Indian stock market. Portfolios sorted on size and investment level of the stocks depict the inverse relationship between investment level of the stock and their stocks returns, as the low investment stocks considered by the investor are more risky than high investment stocks. Conservative portfolios have higher stock return over aggressive portfolios. This is shown in table 4.2, that SSLI and BSLI portfolios have more returns and standard deviation than SSHI and BSHI portfolios. These results also support the risk and relationship found by Cooper et al. (2008); Chiah et al. (2015); Sing and Yadav (2015), Fama and French (2015) . The size effect is consistent in above three sorts of the portfolios, that is, in every sort small size portfolios have more returns than big sort portfolios. This is strong indication of size effect in Pakistan stock market.
(Table 4.2 Inserted here)
In table 4.3 EMPR, SSMBS, HRMLR and LIMHI are risk factors which have positive mean returns while HPMLP has negative mean return. These results indicate that market portfolio offered higher returns over risk free rate. In this study, the average market risk premium has high value than Fama and French (2015) , who reports the .50 % value for US stock market. While, the other risk premiums have also higher average value except HRMLR factor. It is because of lower rate of return on risk free security. The positive values for risk factors show that small size, value and low investment portfolios on average give higher returns over big size, growth and high investment portfolios. These factors are mimicking to the portfolios reported in the table 4.2, that’s why, give results consistent with results of portfolios reported above.
(Table 4.3 Inserted here)
4.3 CORRELATION AMONG RISK FACTORS
In table 4.4, correlation matrix shows that risk premium related to profitability of the stocks is negatively correlated with all other risk premium factors, which is consistent with the Fama and French (2015) and Nguyen et al. The highest negative correlation observe between HRMLR and HPMLP, that is 77%, which shows that value firms tend to low profitable firms and vice versa. There is also negative correlation between HPMLP and LIMHI, that is, high profitable firms tends to be high investment firms and vice versa. The positive correlation between HRMLR and LIMHI shows that high BE-to-ME firms tend to be low investment firms and vice versa. EMPR is positively correlated with size premium, value premium and investment premium but have low correlation. Value premium is also positively correlated with size premium which shows that high BE-to-ME firma also have small size and vice versa. Fama and French (2015) reported mostly negative correlation among factors except positive correlation found among market premium and size premium; value premium and profitability, investment premium.
4.4 REGRESSION RESULTS AND DISCUSSION OF ASSET PRICING MODELS
The ordinary least square (OLS) method is used to estimate the regression parameters as a result of diagnostic the residual that the residual of regression equation is normally distributed, that is, has zero mean, no serially correlated and homoscedastic. In this study, in some cases, residual is heteroscedastic which is detected by the use of Breusch–Pagan–Godfrey Test and White’s General Heteroscedasticity Test.we still use OLS in presence of heteroscedastic residual by adjusting OLS method with White test or Newey-West test. As in results of residual diagnostic in some cases, the residual is only heteroscedastic. So, OLS is only adjusted with white test to correct the standard errors of the coefficients. The use of OLS method in this way is consistent with Shaker and Elgiziry (2015) , Al-Mwalla and Karasneh (2011) and Chiah et al. (2015).
4.4.2 Regression Results and Discussion for 6 Portfolios sorted on size and BE-to-ME
In table 4.5 (A & B), F-F3FM as well as F-F5FM are reported for comparing the performance of both models in pricing the portfolios sorted on size and book equity to market equity variables. In F-F3FM, the coefficients of Excess Market portfolio return, that is β, are Positive and significant at 1% level of significance. The β values are ranged from 0.69 to 1.06. These results regarding β significance accepting the first hypothesis of the study that the β has significant impact on portfolio returns. The positive and significant results of β coefficients consistent with the studies: Faff (2001); Czapkiewicz and Skalna (2010); Hassan and Javed (2011) and Eraslan (2013).
As the limitation of the CAPM that the β does not capture the relationship between size and stock returns. In this study, on average β values are quite similar for small size portfolios (0.92) and big size portfolios (0.91), while the standard deviations for small size portfolios (7.04%, 5.92% and 8.54%) are higher than for big size portfolios (4.85%, 5.52% and 7.03 %). These results show that small size portfolios are more risky than big size because of their high standard deviations, but, the β does not reflect this effect as the average betas are similar for both small and big size portfolios. Therefore, it is concluded that β does not capture the relationship between size and expected stock return. On average, the similar values for β indicate that both small and big size portfolios are equally sensitive to the fluctuations in market portfolio return and priced both small and big size stocks equally which does not make sense on the basis of the risk-return relationship of the securities. So, this study provide evidence that EMPR factor does not enough to price the stocks in terms of return related to size of stocks and there is need to include to size factor in CAPM.
The β of CAMP also has limitation to develop the relationship between value variable and stock returns. This limitation regarding the β values also evident in this study, as the value portfolios and growth portfolios have similar β values (0.96 & 0.96 respectively). On the other hand, the standard deviations are higher for value portfolios (8.54 % and 7.30 %) than growth portfolios (7.04 % and 4.85 %), which shows that on the basis of mean-variance analysis of the portfolios, the value portfolios have more variance in their return patterns and should be give higher returns over growth portfolios, but β does not capture this effect in portfolio returns across BE-to-ME dimension. On average, the similar values for both value portfolios and growth portfolios signify that both portfolios are equally responsive to market returns fluctuations. Therefore, again the results evident for the limitation of β in capturing the relationship between value factor and stock returns. These results regarding the relationship between β and size, value of the stocks were also found by Iqbal and Brooks (2007); Le (2015) .
The coefficients of size premium s associated with size of the stocks are significantly capture the portfolio variations sorted on size variable. The s coefficients are significant in 5 out of 6 portfolios, two of them are significant at 1 % level and other 3 are at significant at 5 % level of significance. This result leads to accept the second hypothesis of the study. The cross-sectional analysis of portfolio returns shows that the coefficients of size premium for small size portfolios have higher values (1.168, 0.464 and0.894, respectively) over big size portfolios (-0.217, -0.272 and 0.0564, respectively). These results evident for the size effect in portfolios sorted on size and here the result support to accept the third hypothesis that the small size portfolios give premium in returns over big size portfolio returns. On average, s coefficient for small size portfolios is 0.842 and for big size portfolios is -0.144. The result of size factor is consistent with Fama and French (1993); Dennis, Perfect, Snow and wiles (1995); Faff (2001); Bundoo (2008); Mirza and Shahid (2008); Hassan and Javed (2011);Hamid et al. (2012); Abbas et al. (2014).
The value factor coefficients h have significant impact on portfolio returns in 4 out of 6 portfolios. This result leads to accept the fourth hypothesis of the study, that is, the risk premium related to BE-to-ME ratio of the stocks significantly capture the portfolio returns variation sorted on BE-to-ME variable. The h coefficients associated with BE-to-ME ratio of the stocks give higher value to value portfolios (0.592 and 0.502, respectively) over growth portfolios (-0.8198 and -0.0849, respectively). This cross-sectional analysis confirms that value portfolios give higher returns over growth portfolios in the Pakistan equity market and this result support to accept fifth hypothesis of the study. The result of value factor is consistent with Fama and French (1993); Dennis, Perfect, Snow and wiles (1995); Faff (2001); Bundoo (2008); Mirza and Shahid (2008); Hassan and Javed (2011); Hamid et al. (2012); Abbas et al. (2014).
Overall, the F-F3FM performs well in explaining the cross-sectional variation in portfolio returns. As the adjusted R2 values range from 63 % to 88 %, consistent with Bhatti and mirza study who reported adjusted R2 up to 85 %, this indicates that the explanatory power of the model is sufficient. F-statistic test the significance of all the factors included in the model at a time while t-statistic test the significance of the individual variables. As the p-value for f-statistics is zero in all cases, which prove that the model is significant in capturing the variation in portfolio returns. The Durbin-Watson statistics are around 2, which indicate that there is no problem regarding the autocorrelation of error terms.
In table 4.5 (B), the F-F5FM gives the same results for Market risk factor, size premium and value premium . The cross-sectional analyses of portfolios are also match with the F-F3FM results. The two new factors included in the F-F5FM are HPMLP and LIMHI, which are seek to be add to improve the performance of F-F3FM. The coefficients of profitability premium p are significant for 2 out of 6 portfolios and the sign of coefficients are also negative for all portfolios which are due to negative correlation among profitability premium and size premium, value premium found in above correlation analysis. The big size portfolios give slightly more returns over small size portfolios which indicate that the big size portfolios are more profitable than small size portfolios. Overall, profitability factor has the little power to explain the portfolio return variations sorted on size and BE-to-ME ratio.
The coefficients of investment premium I also have a moderate significance in capturing the portfolio return variations. As , I coefficients are significant for 3 portfolios out of 6 portfolios. The cross-sectional analysis of portfolios returns for investment premium factor shows that at the both end of BE-to-ME dimension the small size portfolios outperform over big size portfolios, which indicates that small size portfolios are tends to be low investment portfolios. As the correlation between size premium and investment premium is positive observed in correlation matrix. The main objective of the study is to check the performance of the both models. The additions of two new risk factors in model are slightly increasing adjusted R2values. Now, the range of adjusted R2 value for F-F5FM is from 64 % to 90 %. The average adjusted R2 value for F-F3FM is 70 % while for F-F5FM is 74 %. Overall, F-F5FM has little improvement over F-F3FM to explain the portfolio return variations sorted on size and BE-to-ME characteristics of the stocks.
(Table 4.5 (A) Inserted here)
(Table 4.5 (B) Inserted here)
4.4.3 Regression Results and Discussion for 6 Portfolios sorted on size and Profitability
The results for F-F3FM are present in table 4.6 (A). The β coefficients for six portfolios are highly significant at 1 % level of significance, again first hypothesis is accepting. The average of β values for small size and big size portfolios are similar, that is, β does not capture relationship between size and expected returns, but EMPR factor still play significant role in explain the portfolio returns. On average, β values are higher for low profitable portfolios than high profitable portfolios, which mean that low profitable stocks are more sensitive to market portfolio return fluctuations.
SSMBS still capture the size effect, as the small size portfolios give higher returns (0.674, 0.767 and 1.123, respectively) than big portfolios (-0.0479, -0.159 and -0.320, respectively).On the other hand, there is no clear pattern found across profitability dimension because the portfolio return for small size high profitable (1.123) is higher than small size low profitable (0.674) and the portfolio return for big size low profitable (-0.0479) is higher than big size high profitable (-0.320). This result indicates that size factor is unable to capture the return behavior of portfolios sorted on profitability of the stocks. The s coefficient is significant for 4 portfolios out of 6 portfolios.
The h coefficients still capture the variation in portfolio returns on both end of the profitability dimension. The low profitable portfolios give higher return while the high profitable portfolios give negative returns. These results caused by the high negative correlation (77 %) between profitability premium and value premium, which shows that high profitable portfolios are tend to be low BE-to-ME portfolios and vice versa. The result regarding the relationship of BE-to-ME ratio of the stocks and profitability of the stocks is consistent with the Fama and French (1995). However, the relationship between portfolio returns and profitability of the stocks are not capture by the value factor as the Fama and French (2015) found that high profitable stocks have more stock returns than low profitable stocks. The adjusted R2 for F-F3FM are ranged from 58 % to 84 % and on average is 69 %. Again, the F-F3FM has sufficient explanatory power which is similar to the adjusted R-squared of the three factor model studied in former asset test section.
The F-F5FMresults are reported in table 4.6 (B), which shows the similar results for coefficients of EMPR and SSMBS factors. The HRMLR factor becomes insignificant in capturing the cross sectional variation in portfolio returns. This redundant effect of HRMLR factor when two new risk factors are included in the model is consistent with the Fama and French (2015) . The coefficients for profitability factor are significant for 4 out of 6 portfolios at the both end of the profitability dimension. The significance of profitability factor confirms that the variation in portfolio returns sorted on profitability level of the stocks is well captured by profitability premium. This result leads to accept the six hypothesis of the study. The cross-sectional analysis shows that high profitable portfolios give more returns over lower profitable portfolios. The pattern of portfolio returns is downward from high profitable portfolios to low profitable portfolios for both size portfolios. As the high profitable portfolio returns are 0.535 and 0.136 while the lower profitable portfolios have negative returns (-0.510694 and -0.818456, respectively). These results also support to accept the seventh hypothesis of the study. The results regarding profitability factor are consistent with Fama and French (2015) ,Chiah et al. (2015) and Zheng (2015) . The coefficient of investment factor I is insignificant in most of the cases, only for SSLP portfolio it give significant result.
The comparison between F-F3FM and F-F5FM reveals that the addition of HPMLP is logical as its capture return variation related to the profitability level of the stocks. The HRMLR lost its importance in F-F5FMas it is insignificant for 5 portfolios. The LIMHI also insignificant to capture portfolio return variations related to the profitability level of the stocks, only for SSLP portfolio it is significant. The inclusion of the HPMLP factor in F-F3FM increase the explanatory power of the model as it is reflected by the value of the adjusted R-squared. The adjusted R-Squared value reaches to the 91 % which is highest among the tested portfolios. The average adjusted R-Squared for F-F3FM is 69 % while for the F-F5FMis 74 %. Overall, the F-F5FMis best than F-F3FMto explain the cross-sectional variation in portfolio returns sorted on profitability.
(Table 4.6 (A) Inserted here)
(Table 4.6 (B) Inserted here)
4.4.4 Regression Results and Discussion for 6 Portfolios sorted on size and Investment
InF-F3FM, the coefficient of EMPR is positive and highly significant for all 6 portfolios. On average, the β coefficients are similar for both small and big size portfolios (0.89 & 0.89 respectively), that is, CAPM beta does not capture the relationship between size and stock returns. These results are consistent with above regression results. The average β value for low investment portfolios (0.91) is slightly higher than high investment portfolios (0.88), which indicate that low investment portfolios are more sensitive to market portfolio return fluctuations than high investment portfolios.
Size premium still capture the size effect in size-investment sort, but, the size effect significant in small size portfolios. The s coefficient is significant for 4 out of 6 portfolios, 3 of them are for small size portfolios and 1 for big size portfolio. The cross-sectional analysis again confirm that small size portfolio give more return than big size portfolios. On both end of investment level of the portfolios, value of s coefficients for small low investment portfolio (SSLI) is 0.73 while for big size low investment portfolio (BSLI) is -0.06, on the other hand, the s coefficients for small size high investment portfolio (SSHI) is 0.65 and for big size high investment portfolio (BSHI) is -0.32. This result shows that size factor give higher return to small low investment portfolio and small high investment portfolio because the correlation between size premium and investment premium is positive, which point out that the small stocks are tends to be low investment portfolios and vice versa. The HRMLR factor becomes insignificant, only for one portfolio h coefficient is significant. This result shows that value factor is unable to explain the portfolio returns related to investment level of the stocks and also it becomes the limitation of F-F3FM.
The F-F5FM results are reported in table 4.7 (B). The results of EMPR and SSMBS factors are similar to the F-F3FM results. The HRMLR factor again shows insignificant effect in capturing the portfolio returns related to investment. This result regarding the value factor is consistent with the Fama and French (2015).The profitability factor is significant for two portfolios which are small size low investment and high investment portfolios. The profitability premium gives negative sign to all portfolios returns which are mostly observed in all regression results. The possible reason behind that result is that the profitability premium is negatively correlated with all other risk premium factors. As this study is at initial level to apply the F-F5FM in the Pakistan stock market, so, there is need to investigate more this result in future.
Last factor is LIMHI which is associated with investment level of the stocks. The coefficient of investment premium I is significant for 5 portfolios out of 6 portfolios, which shows the significance of investment premium factor to capture the portfolio return variation related to investment level of the stocks and also this result support to accept the hypothesis No.8 . The cross-sectional analysis of the portfolio returns point out that the low investment portfolios gives higher return over high investment portfolios. As I coefficient values are 0.557 and .506 for low investment small size portfolio and big size portfolios respectively, while the -0.7177 and -0.219 are for high investment small size and big size portfolios respectively. These result are consistent with Fama and French (2015) ,Chiah et al. (2015) and Zheng (2015) .
As for the concern of comparison of models performance, the F-F5FM outperforms the F-F3FM because on the basis of the significance of investment factor and adjusted R-Squared, the explanatory power of the F-F5FM is higher than F-F3FM. The adjusted R-squared values for five factors model are ranged from 66 % to 90 %, the average value of five factors model is 78 % and for three factors model is 73 %.
(Table 4.7 (A) Inserted here)
(Table 4.7 (B) Inserted here)
Overall, the results of asset pricing tests in table 4.5 (A & B), 4.6 (A & B) and 4.7 (A & B) illustrate that the five factor model outperforms the three factor model. The asset pricing tested by five factor model show that premium related to five risk factors are priced in portfolio returns. The new factors profitability and investment are also priced and both they are improve the performance of three factor model. As the explanatory power of the F-F5FM is higher than F-F3FM, therefore, theF-F5FM is improved version of F-F3FM and these results give support to accept the hypothesis No. 10 .
The asset pricing models are used to price the different risk factors in stock returns. In this study, F-F5FM applied to check the validity of the model in capturing the portfolio return variation in the Pakistan Stock Market. Both F-F3FM and F-F5FM are compared for purpose to search better asset pricing model. Both F-F3FM and F-F5FM show that market beta β still has greater importance because it found as highly positively significant factor for all tested portfolios, but, it does not hold any relation between stock returns and market capitalization, Book Equity to Market Equity ratio of the stocks. Therefore, it is logical to add both Size and value factor as risk factors in CAPM. The coefficient of size premium significantly captured the size premium in small stocks, that is, in Pakistan stock market small size stocks gives higher returns over big size stocks. The value factor also give significant results and high BE-to-ME portfolio gives higher returns than low BE-to-ME portfolios, that is, in Pakistan stock market value stocks give higher return than growth stocks. The small size stock are viewed by the investors are risky because small size stocks in diversification point of view are less diversified and their financial flexibility is lower than big size stocks. High BE-to-ME stocks are also risky because the market does not give the high value to such stocks and investors considered it risky because of their distress position and sensitivity if these stocks to business risk and financial risk.
There are also evidence that Size and Value factors do not show the clear patterns of stock returns related to Profitability and Investment level of the stocks in F-F3FM. Therefore, the addition of two new factors is also logical. The profitability factor well captures the portfolio return variation sorted on profitability. The results conclude that in Pakistan Stock market high profitable stocks gives higher return than low profitable stocks, that is, there is direct relationship between profitability level of the stock and his stock return. The high profitable stocks are viewed by the investors are prospective and their securities are more demanding in stock market, that’s why, the investment in high profitable stocks give premium over lower profitable stocks. The portfolio returns variation related to investment level of the stocks are also well captured by the F-F5FM. The results conclude that low investment stocks gives higher returns than high investment stocks because the low investment stocks are also small size and high BE-to-ME stocks and these stocks are risky considered by the investors. Therefore, it is logical that the risky stocks give higher return to investors if they invest in low investment stocks. The inclusion of two new factors to three factor becomes the value factor is insignificant and this result is match with the Fama and French (2015) study who also found it insignificant. As this study evidence that F-F5FM well capture the variation in returns of portfolios sorted on size and BE-to-ME, size and profitability, size and investment levels of the stocks than F-F3FM. Therefore, it’s concluded that F-F5FM is better asset pricing model than CAPM and F-F3FM for the Pakistan stock market context.
This study implies that if investors take into account the five risk factors at the time of investment then they get better return on their choice of securities. Investors need to consider the each risk factor in process of constructing the optimal portfolio of securities. With respect to size factor, all tested portfolios exhibit size effect in the Pakistan stock Exchange, that is, if investors want to invest in small size stocks they required to get more returns than big size stocks because of their risky nature. Likewise, value factor also exist in the Pakistan stock exchange, as the high BE-to-ME ratio stocks proved as risky stocks and also give higher returns than Low BE-to-ME ratio stocks, so this result imply that value of the stock is important factor in investment of the stocks. The two new factors which are profitability and investment level of the stocks proposed by Fama and French (2015) also play a significant role in capturing the portfolio return variations in the Pakistan stock exchange, which imply that investor needs to consider these factors at the time of investment.
The importance of this study is that this study concluded that F-F5FM is improved version of F-F3FM; therefore, it can be used for selection of securities selections, for pricing the stocks, to develop portfolios and to analysis the fund management industry. Second, this study extends the literature on searching better asset pricing model and give updates to literature in the Pakistan setting. Third, it used for the calculation of required rate of returns on investment as the CAPM used.
LIMITATIONS OF THE STUDY AND FUTURE SUGGESTION:
(1) Sample period is shorter than other studies found in other stock markets.
(2) No. of firms are also lower; there is a need to extend both sample period and no. of firms in sample for future work.
(3) Researcher calculates equally weighted returns for risk factors as well as for tested portfolios, there is need to calculate the value weighted returns on these factors and tested portfolios.
(4) No. of tested portfolios are lower in this study across size, BE-to-ME, Profitability and investment dimensions, in future research, there is need to extend the no. of portfolios.
(5) There is need to use more test or criterion to suggest the improvement regarding the explanatory power of the asset pricing model.
(6) The risk factors are calculated following the Fama and French (1993, 2015) methodology, the effect of neutral portfolio returns are ignored in calculation of these risk factors. In future, there is need to include the effect of neutral portfolio returns related to the firms characteristics discussed in thesis.
Chiah, M., Chai, D., & Zhong, A. (2015). A better model? An empirical investigation of the Fama-French five-factor model in Australia. Paper presented at the 2015 Financial Markets & Corporate Governance Conference.
Markowitz, H. (1952). Portfolio selection*. The Journal of Finance, 7 (1), 77-91.
Miller, M. H., & Modigliani, F. (1961). Dividend policy, growth, and the valuation of shares. the Journal of Business, 34 (4), 411-433.
Mirza, N., & Shahid, S. (2008). Size and value premium in Karachi Stock Exchange.
Muneer, S., Ali, A. & Ahmad, R. A. (2017). Impact of Financing on Small and Medium Enterprises (SMEs) Profitability with Moderating Role of Islamic Finance. Information Management and Business Review, 9(2), 25-32
Nguyen, N., Ulku, N., & Zhang, J. THE FAMA-FRENCH FIVE FACTOR MODEL: EVIDENCE FROM VIETNAM.
Annexure
Table 3.1 Double Sorting of Stocks on the basis of Size variable and BE-to-ME ratio variable
|
Book Equity-to-Market Equity (BE-to-ME) |
|||
|
Size |
Low Ratio (LR) |
Neutral Ratio(NR) |
High Ratio (HR) |
|
Small Size (SS) |
SSLR |
SSNR |
SSHR |
|
Big Size (BS) |
BSLR |
BSNR |
BSHR |
Table 3.2 Double sorting of stocks on the basis of Size and Profitability variables
|
Profitability (OP) |
|||
|
Size |
Low Profitable(LP) |
Neutral Profitable (NP) |
High Profitable (HP) |
|
Small Size (SS) |
SSLP |
SSNP |
SSHP |
|
Big Size (BS) |
BSLP |
BSNP |
BSHP |
Table 3.3 Double sorting of stocks on the basis of Size and Investment variable
|
Investment (Inv) |
|||
|
Size |
Low Investment (LI) |
Neutral Investment (NI) |
High Investment (HI) |
|
Small Size (SS) |
SSLI |
SSNI |
SSHI |
|
Big Size(BS) |
BSLI |
BSNI |
BSHI |
Table 3.4 Number of Stocks in Each Portfolio Sorted on Size-BE-to-ME, Size-OP and Size-Inv Variables in Each Year
|
Year |
Stocks Sorted on Size-BE-to-ME Ratio |
Total |
|||||
|
SSLR |
SSNR |
SSHR |
BSLR |
BSNR |
BSHR |
||
|
2009 |
11 |
12 |
18 |
14 |
20 |
7 |
82 |
|
2010 |
7 |
13 |
21 |
18 |
19 |
4 |
82 |
|
2011 |
6 |
15 |
20 |
19 |
17 |
5 |
82 |
|
2012 |
7 |
16 |
18 |
18 |
16 |
7 |
82 |
|
2013 |
8 |
16 |
17 |
17 |
16 |
8 |
82 |
|
2014 |
9 |
14 |
18 |
16 |
18 |
7 |
82 |
|
Average |
8 |
14 |
19 |
17 |
18 |
6 |
82 |
|
Year |
Stocks Sorted on Size-OP |
Total |
|||||
|
SSLP |
SSNP |
SSHP |
BSLP |
BSNP |
BSHP |
||
|
2009 |
17 |
15 |
9 |
8 |
17 |
16 |
82 |
|
2010 |
17 |
14 |
10 |
8 |
18 |
15 |
82 |
|
2011 |
17 |
18 |
6 |
8 |
14 |
19 |
82 |
|
2012 |
17 |
18 |
6 |
8 |
14 |
19 |
82 |
|
2013 |
17 |
19 |
5 |
8 |
13 |
20 |
82 |
|
2014 |
15 |
16 |
10 |
10 |
16 |
15 |
82 |
|
Average |
17 |
16 |
8 |
8 |
16 |
17 |
82 |
|
Year |
Stocks Sorted on Size-Inv |
Total |
|||||
|
SSLI |
SSNI |
SSHI |
BSLI |
BSNI |
BSHI |
||
|
2009 |
14 |
15 |
12 |
11 |
17 |
13 |
82 |
|
2010 |
15 |
13 |
13 |
10 |
19 |
12 |
82 |
|
2011 |
14 |
15 |
12 |
11 |
17 |
13 |
82 |
|
2012 |
14 |
14 |
13 |
11 |
18 |
12 |
82 |
|
2013 |
16 |
12 |
13 |
9 |
20 |
12 |
82 |
|
2014 |
11 |
18 |
12 |
14 |
14 |
13 |
82 |
|
Average |
14 |
15 |
12 |
11 |
17 |
13 |
82 |
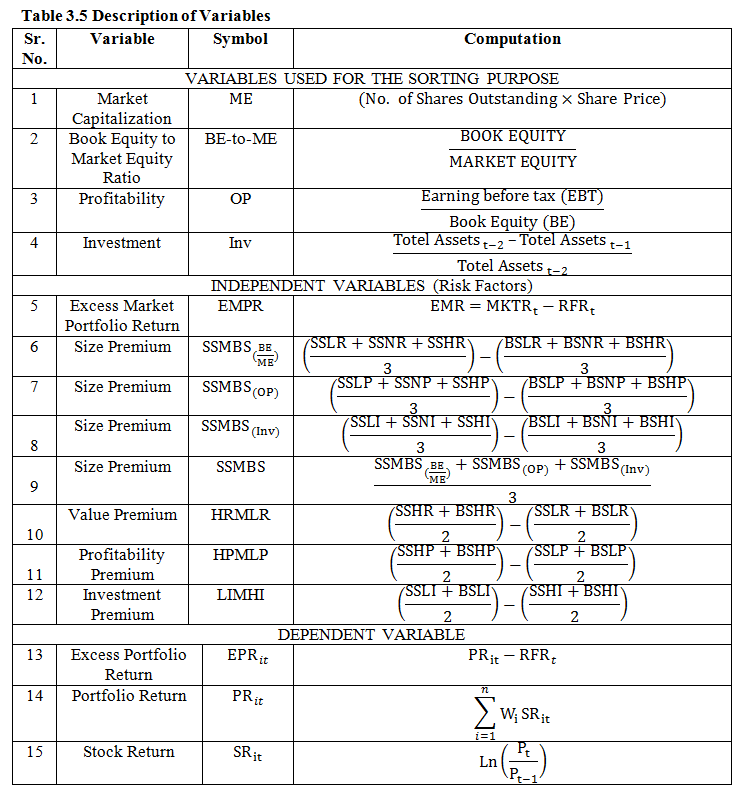
Table 4.1 Augmented Dickey--Fuller test (ADF) Results
|
Stationary Test For 6 Size And Book Equity-To-Market Equity Sorted Portfolios |
|||||||||||||
|
ADF test statistic |
Test critical values (at 5% level) |
||||||||||||
|
BE-to-ME ratio |
BE-to-ME ratio |
||||||||||||
|
LR |
NR |
HR |
LR |
NR |
HR |
||||||||
|
SIZE |
SS |
-8.8635 |
-8.9203 |
-8.1149 |
-3.4744 |
-3.4744 |
-3.4744 |
||||||
|
BS |
-8.1296 |
-8.4619 |
-8.9773 |
-3.4744 |
-3.4744 |
-3.4744 |
|||||||
|
Stationary Test For 6 Size And Profitability Sorted Portfolios |
|||||||||||||
|
Profitability |
Profitability |
||||||||||||
|
LP |
NP |
HP |
LP |
NP |
HP |
||||||||
|
SIZE |
SS |
-8.0218 |
-8.5964 |
-8.9351 |
-3.4744 |
-3.4744 |
-3.4744 |
||||||
|
BS |
-8.3379 |
-8.7595 |
-8.3390 |
-3.4744 |
-3.4744 |
-3.4744 |
|||||||
|
Stationary Test For 6 Size And Investment Sorted Portfolios |
|||||||||||||
|
Investment |
Investment |
||||||||||||
|
LI |
NI |
HI |
LI |
NI |
HI |
||||||||
|
SIZE |
SS |
-8.0157 |
-8.394 |
-9.0348 |
-3.4744 |
-3.4744 |
-3.4744 |
||||||
|
BS |
-8.8411 |
-8.9197 |
-7.8880 |
-3.4744 |
-3.4744 |
-3.4744 |
|||||||
|
Stationary Test For Independent Variables |
|||||||||||||
|
Variable |
ADF test stat |
Test critical values |
|||||||||||
|
EMR |
-9.285598 |
-3.474363 |
|||||||||||
|
SSMBS |
-8.473265 |
-3.475305 |
|||||||||||
|
HRMLR |
-5.910254 |
-3.476275 |
|||||||||||
|
HPMLP |
-4.904247 |
-3.476275 |
|||||||||||
|
LIMHI |
-7.826575 |
-3.474363 |
|||||||||||
|
Test criteria to decide whether time series data is stationary or non-stationary |
|||||||||||||
|
Null hypothesis: θ = 0 (time series is non-stationary) |
|||||||||||||
|
Alternative Hypothesis: θ < 0 (time series is stationary) |
|||||||||||||
|
if, ADF TEST STAT. < Test critical value (reject null hypothesis) |
|||||||||||||
|
if , ADF TEST STAT. > Test critical value (accept null hypothesis) |
|||||||||||||
Table 4.2 Descriptive Statistics for Monthly Excess Portfolio Returns
|
Monthly Excess Portfolio returns sorted on Size and BE-to-ME ratio |
||||||
|
SSLR |
SSNR |
SSHR |
BSLR |
BSNR |
BSHR |
|
|
Mean |
1.18% |
0.82% |
1.58% |
0.17% |
0.40% |
0.50% |
|
Median |
1.13% |
1.07% |
1.21% |
0.78% |
0.57% |
0.48% |
|
Maximum |
15.83% |
13.46% |
22.68% |
9.56% |
15.41% |
11.95% |
|
Minimum |
-19.94% |
-11.37% |
-23.50% |
-15.51% |
-14.55% |
-16.60% |
|
Std. Dev. |
7.04% |
5.92% |
8.54% |
4.85% |
5.52% |
7.03% |
|
Monthly Excess Portfolio returns sorted on Size and Profitability |
||||||
|
SSLP |
SSNP |
SSHP |
BSLP |
BSNP |
BSHP |
|
|
Mean |
1.79% |
0.79% |
0.93% |
0.44% |
0.31% |
0.35% |
|
Median |
1.30% |
0.66% |
1.05% |
0.75% |
0.61% |
0.30% |
|
Maximum |
24.62% |
14.97% |
18.08% |
15.31% |
12.94% |
11.20% |
|
Minimum |
-22.45% |
-14.24% |
-15.38% |
-17.86% |
-16.74% |
-12.31% |
|
Std. Dev. |
8.94% |
5.99% |
6.98% |
7.44% |
5.69% |
4.56% |
|
Monthly Excess Portfolio returns sorted on Size and Investment |
||||||
|
SSLI |
SSNI |
SSHI |
BSLI |
BSNI |
BSHI |
|
|
Mean |
2.07% |
1.04% |
0.54% |
0.63% |
0.40% |
0.01% |
|
Median |
1.61% |
0.81% |
-0.20% |
1.53% |
0.68% |
0.02% |
|
Maximum |
26.60% |
16.85% |
15.35% |
12.41% |
13.41% |
12.66% |
|
Minimum |
-18.92% |
-17.20% |
-14.65% |
-17.32% |
-14.37% |
-14.59% |
|
Std. Dev. |
8.06% |
6.75% |
6.36% |
5.56% |
5.49% |
5.23% |
Table 4.3 Descriptive Statistics for Monthly Risk Factors (Independent Variables)
|
EMPR |
SSMBS |
HRMLR |
HPMLP |
LIMHI |
|
|
Mean |
1.26% |
0.84% |
0.36% |
- 0.48% |
1.08% |
|
Median |
1.74% |
0.56% |
-0.81% |
- 0.23% |
1.06% |
|
Maximum |
13.19% |
9.03% |
18.13% |
10.00% |
16.29% |
|
Minimum |
-12.19% |
-7.58% |
-9.10% |
-19.90% |
-8.18% |
|
Std. Dev. |
5.05% |
2.87% |
5.09% |
5.56% |
3.35% |
Table 4.4 Correlation among Risk Factors
|
EMPR |
SSMBS |
HRMLR |
HPMLP |
LIMHI |
|
|
EMPR |
100% |
||||
|
SSMBS |
20% |
100% |
|||
|
HRMLR |
45% |
23% |
100% |
||
|
HPMLP |
-42% |
-14% |
-77% |
100% |
|
|
LIMHI |
23% |
23% |
39% |
-51% |
100% |
Table 4.5 (A) Regression Results for 6 portfolios sorted on Size and BE-to-ME ratio
|
THREE FACTOR MODEL (F-F3FM) |
||||||
|
Book Equity to Market Equity |
||||||
|
Size |
LR |
NR |
HR |
LR |
HR |
HR |
|
α |
P- value |
|||||
|
SS |
-0.008 |
-0.005 |
-0.007 |
0.061 |
0.193 |
0.079 |
|
BS |
-0.007 |
-0.006 |
-0.009 |
0.014 |
0.115 |
0.012 |
|
|
β |
|||||
|
SS |
1.058 |
0.696 |
1.014 |
0.000*** |
0.000*** |
0.000*** |
|
BS |
0.871 |
0.938 |
0.916 |
0.000*** |
0.000*** |
0.000*** |
|
|
s |
|||||
|
SS |
1.1682 |
0.4644 |
0.8942 |
0.000*** |
0.012** |
0.000*** |
|
BS |
-0.2175 |
-0.2728 |
0.0565 |
0.038** |
0.029** |
0.723 |
|
|
h |
|||||
|
SS |
-0.8199 |
0.2543 |
0.5924 |
0.000*** |
0.098* |
0.000*** |
|
BS |
-0.0849 |
0.0509 |
0.5028 |
0.249 |
0.504 |
0.000*** |
|
|
F-Stat. |
|||||
|
SS |
74.318 |
40.801 |
173.134 |
0.000*** |
0.000*** |
0.000*** |
|
BS |
62.595 |
65.337 |
86.373 |
0.000*** |
0.000*** |
0.000*** |
|
|
Adjusted-R2 |
Average Adjusted-R2 = 70 % |
||||
|
SS |
76% |
63% |
88% |
|||
|
BS |
72% |
73% |
78% |
|||
|
|
Durbin-Watson |
|||||
|
SS |
1.75 |
1.70 |
1.92 |
|||
|
BS |
2.19 |
1.73 |
1.72 |
|||
***, **, *referred to significant at 1 %, 5 % and 10 % level respectively.
Table 4.5 (B) Regression Results for 6 portfolios sorted on Size and BE-to-ME ratio
|
FIVE FACTOR MODEL (F-F5FM) |
||||||
|
SIZE |
Book equity to Market Equity |
|||||
|
LR |
NR |
HR |
LR |
HR |
HR |
|
|
α |
P- value |
|||||
|
SS |
-0.010 |
-0.004 |
-0.009 |
0.019 |
0.447 |
0.009 |
|
BS |
-0.009 |
-0.005 |
-0.010 |
0.007 |
0.151 |
0.023 |
|
|
β |
|
||||
|
SS |
1.027 |
0.684 |
0.982 |
0.000*** |
0.000*** |
0.000*** |
|
BS |
0.855 |
0.925 |
0.900 |
0.000*** |
0.000*** |
0.000*** |
|
|
s |
|
||||
|
SS |
1.151 |
0.523 |
0.861 |
0.000*** |
0.001*** |
0.000*** |
|
BS |
-0.241 |
-0.252 |
0.048 |
0.029** |
0.049** |
0.739 |
|
|
h |
|
||||
|
SS |
-1.040 |
0.173 |
0.364 |
0.000*** |
0.204 |
0.001*** |
|
BS |
-0.200 |
-0.039 |
0.396 |
0.036** |
0.717 |
0.002*** |
|
|
p |
|
||||
|
SS |
-0.21609 |
-0.17297 |
-0.20273 |
0.0757* |
0.1857 |
0.0395** |
|
BS |
-0.09108 |
-0.12903 |
-0.10445 |
0.3116 |
0.2187 |
0.3802 |
|
|
I |
|
||||
|
SS |
0.215832 |
-0.25612 |
0.299845 |
0.125 |
0.092* |
0.009*** |
|
BS |
0.189807 |
-0.05747 |
0.105794 |
0.071* |
0.635 |
0.443 |
|
|
F-Stat. |
|
||||
|
SS |
50.95687 |
25.721 |
132.3366 |
0.000*** |
0.000*** |
0.000*** |
|
BS |
41.48937 |
39.24714 |
52.39322 |
0.000*** |
0.000*** |
0.000*** |
|
Adjusted-R2 |
Average Adjusted-R2 = 74 %
|
|||||
|
SS |
78% |
64% |
90% |
|||
|
BS |
74% |
73% |
78% |
|||
|
|
Durbin-Watson Stat. |
|||||
|
SS |
1.96 |
1.71 |
1.96 |
|||
|
BS |
2.21 |
1.75 |
1.82 |
|||
***, **, *referred to significant at 1 %, 5 % and 10 % level respectively
Table 4.6 (A) Regression results for 6 portfolios sorted on Size and Profitability
|
THREE FACTOR MODEL (F-F3FM) |
|||||||||
|
Profitability |
|||||||||
|
Size |
LP |
NP |
HP |
LP |
NP |
HP |
|||
|
α |
p- value |
||||||||
|
SS |
-0.0040 |
-0.0071 |
-0.0106 |
0.371 |
0.149 |
0.022 |
|||
|
BS |
-0.0085 |
-0.0079 |
-0.0042 |
0.149 |
0.036 |
0.135 |
|||
|
|
β |
||||||||
|
SS |
1.107 |
0.637 |
0.964 |
0.000*** |
0.000*** |
0.000*** |
|||
|
BS |
0.940 |
0.958 |
0.856 |
0.000*** |
0.000*** |
0.000*** |
|||
|
|
s |
||||||||
|
SS |
0.674 |
0.767 |
1.123 |
0.000*** |
0.000*** |
0.000*** |
|||
|
BS |
-0.048 |
-0.159 |
-0.321 |
0.811 |
0.209 |
0.001*** |
|||
|
|
h |
||||||||
|
SS |
0.620 |
0.143 |
-0.464 |
0.000*** |
0.170 |
0.004*** |
|||
|
BS |
0.390 |
0.063 |
-0.123 |
0.002*** |
0.418 |
0.039** |
|||
|
|
F-Stat. |
||||||||
|
SS |
129.17 |
33.32 |
43.81 |
0.000*** |
0.000*** |
0.000*** |
|||
|
BS |
37.73 |
66.31 |
78.68 |
0.000*** |
0.000*** |
0.000*** |
|||
|
|
Adjusted-R2 |
Average Adjusted-R2 = 69 % |
|||||||
|
SS |
84% |
58% |
64% |
||||||
|
BS |
61% |
73% |
77% |
||||||
|
|
Durbin-Watson stat. |
||||||||
|
SS |
1.82 |
1.72 |
2.25 |
||||||
|
BS |
1.96 |
2.10 |
2.11 |
||||||
***, **, *referred to significant at 1 %, 5 % and 10 % level respectively.
Table 4.6 (B) Regression results for 6 portfolios sorted on Size and Profitability
|
FIVE FACTOR MODEL (F-F5FM) |
||||||
|
SIZE |
Profitability |
|||||
|
LP |
NP |
HP |
LP |
NP |
HP |
|
|
α |
p- value |
|||||
|
SS |
-0.00698 |
-0.00602 |
-0.01138 |
0.048 |
0.238 |
0.024 |
|
BS |
-0.0091 |
-0.00884 |
-0.0047 |
0.062 |
0.024 |
0.102 |
|
|
β |
|
||||
|
SS |
1.040 |
0.620 |
1.019 |
0.000*** |
0.000*** |
0.000*** |
|
BS |
0.848 |
0.951 |
0.869 |
0.000*** |
0.000*** |
0.000*** |
|
|
s |
|
||||
|
SS |
0.669 |
0.812 |
1.047 |
0.000*** |
0.000*** |
0.000*** |
|
BS |
0.031 |
-0.177 |
-0.347 |
0.847 |
0.175 |
0.001*** |
|
|
h |
|
||||
|
SS |
0.146 |
0.027 |
-0.076 |
0.152 |
0.854 |
0.600 |
|
BS |
-0.254 |
0.018 |
-0.032 |
0.073* |
0.874 |
0.698 |
|
|
p |
|
||||
|
SS |
-0.511 |
-0.190 |
0.535 |
0.000*** |
0.181 |
0.000*** |
|
BS |
-0.818 |
-0.025 |
0.136 |
0.000*** |
0.818 |
0.090* |
|
|
I |
|
||||
|
SS |
0.297 |
-0.164 |
0.171 |
0.010** |
0.320 |
0.287 |
|
BS |
-0.043 |
0.117 |
0.082 |
0.781 |
0.349 |
0.373 |
|
|
F-Stat. |
|
||||
|
SS |
145.336 |
20.45015 |
34.43601 |
0.000*** |
0.000*** |
0.000*** |
|
BS |
44.38556 |
39.62277 |
48.5421 |
0.000*** |
0.000*** |
0.000*** |
|
Adjusted-R2 |
Average Adjusted-R2 = 74 %
|
|||||
|
SS |
91% |
58% |
70% |
|||
|
BS |
75% |
73% |
77% |
|||
|
|
Durbin-Watson Stat. |
|||||
|
SS |
1.95 |
1.70 |
2.10 |
|||
|
BS |
2.22 |
2.08 |
2.07 |
|||
***, **, *referred to significant at 1 %, 5 % and 10 % level respectively
Table 4.7 (A) Regression results for 6 portfolios sorted on Size and Investment
|
THREE FACTOR MODEL (F-F3FM) |
|||||||
|
Investment |
|||||||
|
Size |
LI |
NI |
HI |
LI |
NI |
HI |
|
|
α |
P- value |
||||||
|
SS |
-0.0005 |
-0.0087 |
-0.0113 |
0.999 |
0.053 |
0.008 |
|
|
BS |
-0.0037 |
-0.0074 |
-0.0086 |
0.419 |
0.011 |
0.012 |
|
|
|
β |
||||||
|
SS |
1.034 |
0.793 |
0.860 |
0.000*** |
0.000*** |
0.000*** |
|
|
BS |
0.785 |
1.005 |
0.896 |
0.000*** |
0.000*** |
0.000*** |
|
|
|
s |
||||||
|
SS |
0.726 |
1.019 |
0.651 |
0.000*** |
0.000*** |
0.001*** |
|
|
BS |
-0.064 |
-0.160 |
-0.326 |
0.677 |
0.101 |
0.005*** |
|
|
|
h |
||||||
|
SS |
0.434 |
0.153 |
0.091 |
0*** |
0.1037 |
0.5679 |
|
|
BS |
0.145 |
0.013 |
0.045 |
0.1314 |
0.8284 |
0.5203 |
|
|
|
F-Stat. |
||||||
|
SS |
103.66 |
64.65 |
51.31 |
0.000*** |
0.000*** |
0.000*** |
|
|
BS |
34.08 |
118.08 |
69.05 |
0.000*** |
0.000*** |
0.000*** |
|
|
|
Adjusted-R2 |
Average Adjusted-R2 = 73% |
|||||
|
SS |
81% |
73% |
68% |
||||
|
BS |
58% |
83% |
74% |
||||
|
|
Durbin-Watson stat. |
||||||
|
SS |
2.09 |
1.89 |
2.16 |
||||
|
BS |
2.06 |
1.71 |
2.02 |
||||
***, **, *referred to significant at 1 %, 5 % and 10 % level respectively.
Table 4.7 (B) Regression results for 6 portfolios sorted on Size and Investment
|
FIVE FACTOR MODEL (F-F5FM) |
||||||
|
SIZE |
Investment |
|||||
|
LI |
NI |
HI |
LI |
NI |
HI |
|
|
α |
p- value |
|||||
|
SS |
-0.005 |
-0.011 |
-0.006 |
0.151 |
0.014 |
0.113 |
|
BS |
-0.008 |
-0.008 |
-0.007 |
0.035 |
0.010 |
0.041 |
|
|
β |
|
||||
|
SS |
0.982 |
0.777 |
0.857 |
0.000*** |
0.000*** |
0.000*** |
|
BS |
0.763 |
0.990 |
0.887 |
0.000*** |
0.000*** |
0.000*** |
|
|
s |
|
||||
|
SS |
0.659 |
0.974 |
0.791 |
0.000*** |
0.000*** |
0.000*** |
|
BS |
-0.145 |
-0.154 |
-0.277 |
0.226 |
0.120 |
0.018** |
|
|
h |
|
||||
|
SS |
0.067 |
0.036 |
0.074 |
0.498 |
0.781 |
0.577 |
|
BS |
-0.012 |
-0.086 |
-0.019 |
0.924 |
0.314 |
0.844 |
|
|
p |
|
||||
|
SS |
-0.305 |
-0.064 |
-0.220 |
0.002*** |
0.606 |
0.097* |
|
BS |
-0.056 |
-0.117 |
-0.142 |
0.672 |
0.152 |
0.137 |
|
|
I |
|
||||
|
SS |
0.557 |
0.300 |
-0.718 |
0.000*** |
0.040** |
0.000*** |
|
BS |
0.506 |
0.022 |
-0.219 |
0.021** |
0.813 |
0.049** |
|
|
F-Stat. |
|
||||
|
SS |
123.86 |
42.54 |
51.50 |
0.000*** |
0.000*** |
0.000*** |
|
BS |
28.85 |
72.23 |
44.02 |
0.000*** |
0.000*** |
0.000*** |
|
Adjusted-R2 |
Average Adjusted-R2 = 78 %
|
|||||
|
SS |
90% |
75% |
78% |
|||
|
BS |
66% |
83% |
75% |
|||
|
|
Durbin-Watson Stat. |
|||||
|
SS |
2.26 |
1.77 |
2.19 |
|||
|
BS |
2.15 |
1.67 |
2.13 |
|||
***, **, *referred to significant at 1 %, 5 % and 10 % level respectively

