|
Neeraj Kumar Dept. of Economics, IBS Hyderabad Telangana (India) |
Pooja Choudhary Independent Economics Researcher Hyderabad, Telengan (India) |
The Indian automobile industry occupies a prominent place in Indian economy. It passed from different phases, the emergence of indigenous automobile manufactures and self reliance before 1983 to Freedom to Grow after 1991 economic reforms. The present paper analyzed the concentration ratio of each segment Indian automobile industry. It further investigated firm level market shares of each individual firm in their respective segment from 1991-92 to 2013-14. The study found that the economic reforms of 1991 dissolved the entry, exit and FDI restrictions which lead entry of foreign players and competition goes on increasing and the concentration ratio starts declining in Indian automobile industry.
Keywords: Automobile, Structure, Concentration, Reforms JEL Classification: L620Theoretically one can consider perfect competitive market as the ideal market where two pivot assumptions i) large numbers of seller (buyer) and ii) independently acting seller (buyer) prevailed. With the help of these two assumptions there is no possibility of discrepancy among price and marginal receipts to attain profit maximization. But, the markets of the real world differ mostly in the number of firms and their relative size. The public are concerned about industrial concentration, because they are concerned about its economic and political effects. The economist should, therefore, analyze at least the economic effects and assess their importance (Citovsky 1955). The industrial theory assumes that concentration is an important component of the market structure which further determines the conduct and performance of concerned firm or industry. Thus, it is important to discuss the each and every aspects of concentration. Concentration defined as the economic position of a firm or industry in which enables the concern to command control over production (possession of considerable share of the total productive capacity, control over raw material and inputs) or market exchange (power to influence the supply) or employment (power to influence the terms and conditions in respect of employment) in respect of any good or service. Thus, concentration treated as a technical concept dealing with concentration ratio giving the shares of the largest few firms in respect of some specific characteristics. Concentration is the capacity to influence economic decisions affecting the lives of large number of people, which is wielded by one or more persons, who has some obtained such capacity (Vakil, 1973). Thus, we see concentration is an important dimension of market structure. Therefore, it is thought to play an important part in determining business behavior and performance.
The basic duty of any government is to control, distribute and give right of ownership of material resources in such a manner so that each and every individual get benefitted. The article 39b and 39c of Indian constitution indicated the ‘directive principles of state policy”, where consider that the ownership and control of material resources of the community are so distributed as best to sub serve the common good and that the operation of the economic system does not result in the concentration of wealth and means of production to common detriment. To prevent the economic concentration the Indian government taken several policy measures time to time. Government set different objective in their five years plans to check and achieve reduction in monopoly power. The different measures in different plans are:
The objective of second five year plan was to reduction of inequalities in wealth and income and more even distribution of economic power.
The third five year plan follow the same objective of earlier plan’s and further gave more importance to the public sector to control the concentration of economic power.
The fourth plan looked to the monopoly legislation and appropriate fiscal policy to reduce the concentration of economic power and further to encourage small scale industries.
Besides these, government set up some historical committee towards monopoly power which prove mile stone in Indian economy like Mahalanobis Committee (1960), Monopoly Inquiry Commission (MIC, 1964) and MRTP Act (1969). In October 1960 the Planning Commission appointed a committee to inquire into how the additional generated income in the first and second five year plan was distributed under the chairmanship of P.C Mahalanobis. The committee found that concentration had increased significantly during 1951-58. There was a high degree of concentration, personal wealth held in the form of company shares than in the form of land or owner occupied houses and wealth distribution seemed to be more unequal than income distribution. In 1964 under the supervision of K.C Dasgupta Monopolies Inquiry Commission (MIC) appointed to check the existence and effect of concentration and investigated product-wise concentration in respect of 100 commodities. The commission adopted the following method to measure the concentration level:
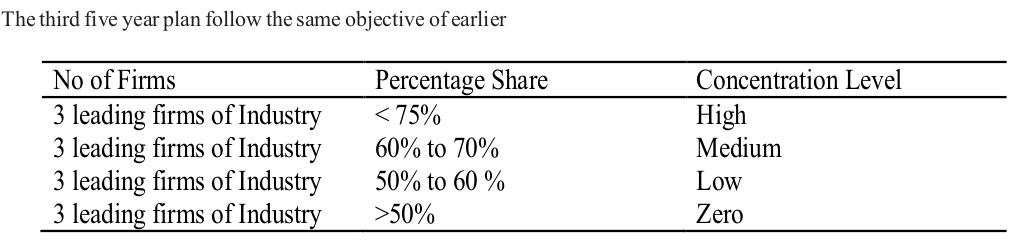
Where if share of top three producers is 75 per cent or more, the concentration considered as high and if share is more than 60 per cent and less than 75 per cent regarded medium concentrations. Where in case of country-wise concentration MIC examined data regarding 2259 companies which appeared to belong to one or other of 83 big business groups that were operating in the country. The Monopoly Inquiry Commission had submitted its report and recommendation in the form of draft bill in 1965 with this draft as the basis, the Monopolies and Restrictive trade Practice (MRTP) bill was presented in parliament in August 1967. But, during 1990s Indian economy face economic crisis and government took many reforms in different sectors and relaxed the restrictions of MRTP Act up-to some extent. Some companies owned by few business houses like Tata group controls, viz, TISCO, TELCO, Tata Chemicals, PAL, Titan, Tata Textiles,Tata Consultancy Services, Tata Tea, Tata Salt, etc. Similarly, the Birla Group of companies such as Hindustan Motors, The Hindustan Times, Hindusthan Aluminium Co. Ltd., Texmaco, Indian Linoleums, etc. are controlled by the Birla Family. They control production of several commodities at the national level. In 1989-90, among the top 20 business houses, the top five, viz, Birla, Tata, Reliance, Singhania and Thappar accounted for total assets of Rs 24,930 crores i.e. 60 per cent of the total assets of 20 business houses (Mukherjee and Chakrabarti, 2000). The present study is an attempt to compute the concentration ratios in case of different segments of automobile industry of India.
The data have been taken from the various secondary sources like Centre for Monitoring Indian Economy (CMIE, PROWESS) reports, Society of Indian Automobile Manufacturers (SIAM) reports and related searches on the internet from 1991-92 to 2013-14. The data on Herfindahl Index has been calculated using different segment’s firm level data on 5 different segments (Light Commercial Vehicle, Passenger Cars, Motor-Cycles, Mopeds and Three-Wheelers), which was available on the PROWESS database. The Herfindahl Index is the sum of the squares of the relative sizes (i.e. market shares) of the firms in the market, where the relative sizes are expressed as proportions of the total size of the market (Barthwal, 2000). Herfindahl Index= ∑ (Pi)2 ; where i=1,2,.....,n Where Pi=qi/Q, qi is output of the ith firm and Q is the total output of all the firms in the market, and n is the total number of firms. The maximum value for the index is one where only one firm occupies the whole market. This is the case of a monopoly. The index will have minimum value when the n firms in the market hold an identical share. This will be equal to 1/n, that is Herfindahl Index =∑ (1/n)2= 1/n The index is simple to calculate. It takes account of all the firms and their relative sizes; it is therefore popular in use and consistent with the theory of oligopoly.
Market concentration is the ratio of sales of ‘n’ firms to industry sales. Market concentration has been studied because it is a measure of monopoly power and helped to draw government policies. Many researchers had studied concentration in different regions of world like Eveley and Little (1960) tried to gauge into British Industry. Many researchers also have shown their interest in developing countries like White (2015) tried to measure concentration ratio in manufacturing industry of Pakistan. In case of Indian automobile industry Mukherjee and Chakrabarti (2000) gauged concentration level. They observed that few firms in Indian automobile sector produced the bulk of output, where they consider these firms as oligopoly firms (oligopoly refers to a situation where few firms say 5 to 6 dominate the entire industry). They found that in the automobile industry, there were three leading producers Maruti Udyog Ltd., the Hindustan Motors and the Premier Automobiles Ltd. In case of commercial vehicles they further observed the dominance of two major firms Telco and Ashok Leyland and in jeep segment Mahindra & Mahindra and Tata Account for the major portion of industry output and sales. George et al. (2002) studied the evolution of the competitive structure of the two wheeler industry in India employing Kendhall’s Index of rank-concordance and the Evnas-Karras test of convergence. They calculated Herfindhal index (HHI) over a period of 10 years for both the two wheeler as a whole and for each of the segments. They observed that on an average the HHI has varied between 0.20 and 0.25 for the two wheeler industry which implies that the two wheeler industry has emerged as an oligopolistic industry where product differentiation is a decisive variable. At the level of individual segments, the oligopolistic forces are more pronounced both in the pre-reform (1998-90) and post reform (1991-99) periods, with the index varying on an average between 0.3 and 0.7. In the present study we also have calculated two firm level concentration ratios of different segment level as well as firm level in each segment over the period 1991-92 to 2013-14.
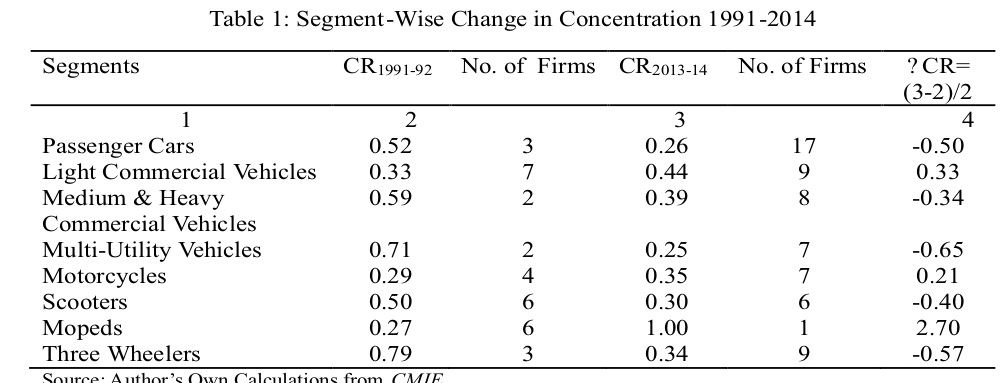
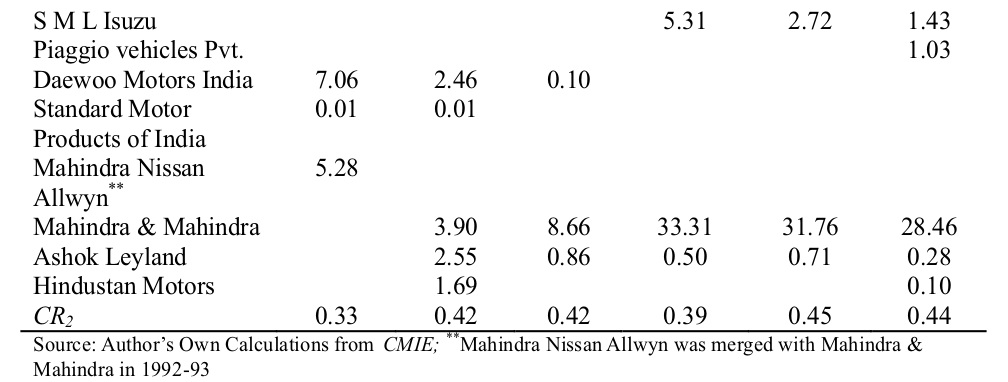
Table 1 gives snapshot of changing concentration in different segments of Indian automobile industry. During 1991-2011, light commercial vehicles, motorcycles and mopeds segments gain momentum in concentration ratio 0.33, 0.21 and 2.70 respectively. The mopeds segment has achieved almost pure monopoly. In case of Mopeds, due to falling demand, manufacturers shift to motor-cycles and scooter segments. In 2013-14, the TVS remained sole manufacturer of mopeds (Kumar and Kaur 2014). That is why in case of moped segment the concentration ratio become 1.00, indicating perfect monopoly power. The remaining segments like Passenger Cars, Medium & Heavy Commercial Vehicles, Multi-Utility Vehicles, Scooters and Three Wheelers reported decline in concentration ratio and moving towards competitive markets. After economic reforms which is known as openness of Indian shore for the rest of the world, entry, exit and FDI restrictions dissolved which attract the foreign players and India become the favourites destination for them. As India seeks to become one of the world’s largest automobile markets, it is interesting to look at its evolution over the years. India’s attraction as a destination for automobile manufacturers has been underscored by the number of new manufacturers entering the country over the last two decades. Unlike in several markets, the number of manufacturers has continued to grow in India over the years across vehicle segments (KPMG 2010). Due to entry of foreign players competition goes on increasing and the concentration ratio starts declining. We observed that three-wheelers segments transformed from a very high concentration oligopoly type (0.79 per cent) to a medium concentration oligopoly type (0.34 per cent). We also observed that passenger cars concentration ratio remained half in 2013-14, which shows that there is increase in competition in passenger cars segments due to high entry of global players. Besides segment wise concentration analysis the study also exhibits the firm level market share of each firm in their respective segment. The table 2 to 9 represents the market share of each firm.
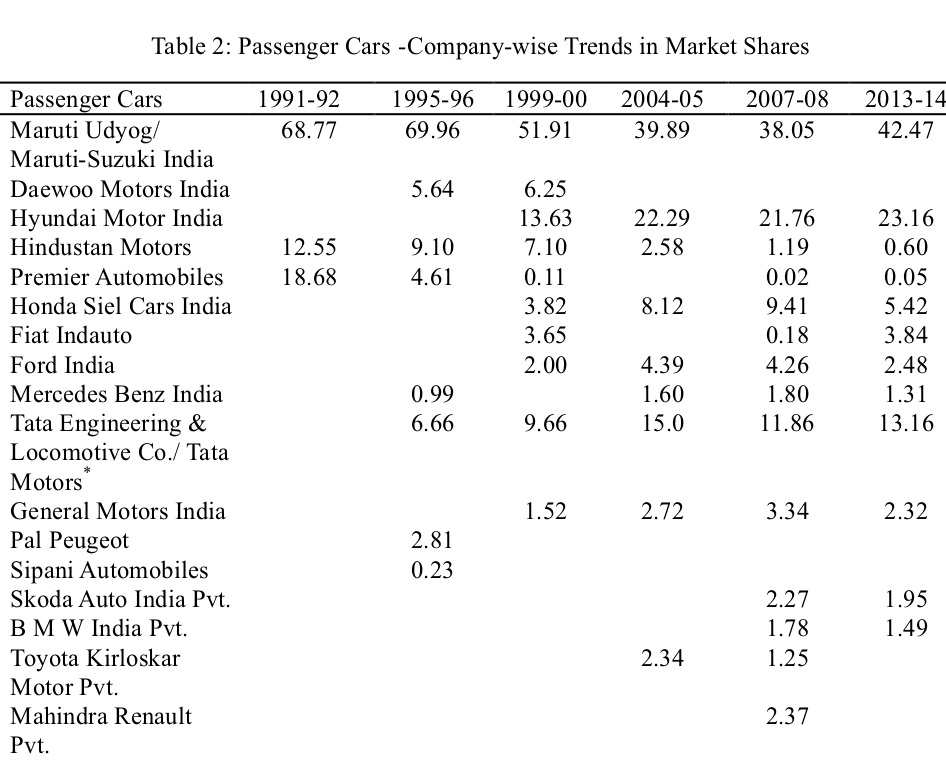
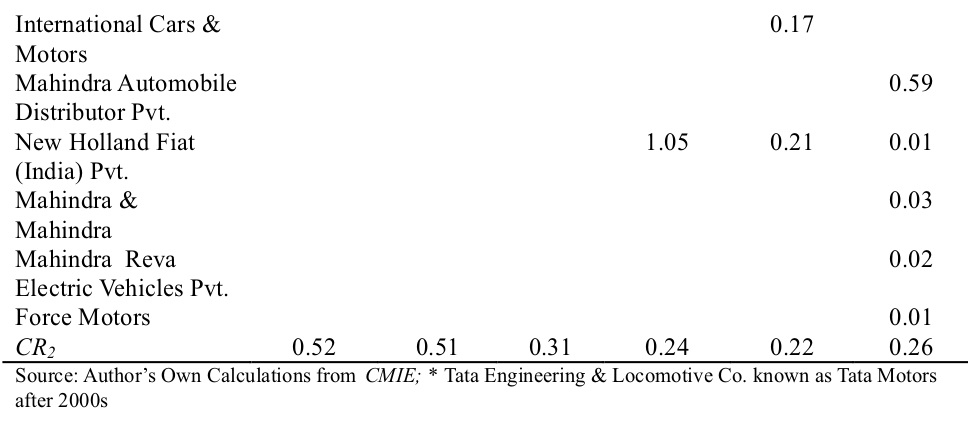
The financial woes of the country in 1991, the government accepted a loan from IMF’s Compensatory and Contingency Financing Facility. This financial help accompanied conditionalities regarding control measures for budget deficit as well as the implementation of economic structural reforms. The overall changes in industrial policy had brought a significant impact on the Indian automobile industry. The passenger car segment with the highest untapped growth potential saw the most hectic activities from the foreign automotive firms. By mid-1990s, several foreign players had entered into the Indian passenger car market by mainly setting up JVs with the local firms – Mercedes-Benz with TELCO, General Motors with HML, Peugeot with PAL, Daewoo with acquisition of DCM-Toyota, Honda Motors with Siel Ltd., Ford with M&M, Hyundai with a 100 per cent-owned subsidiary, Fiat with Tata Motors and Toyota with Kirloskar Group (Ranawat and Tiwari 2009). It is clearly seen that after structural reforms of 1990s, number of firms increases year by year. This further leads competition in passenger cars segment. However, when analyzed share in total sales at individual firm level. Maruti-Suzuki more or less maintains their dominancy in total passenger cars sales 68.77 and 42.47 per cent during 1991-92 and 2013-14 respectively. Followed by Hyundai Motor India which rapidly registered their presence in passenger car market and twice their share from 13.63 to 23.16 per cent during 1999-00 to 2013-14 respectively. Whereas some firms like Premier Automobiles lost their ground in this very important segment.
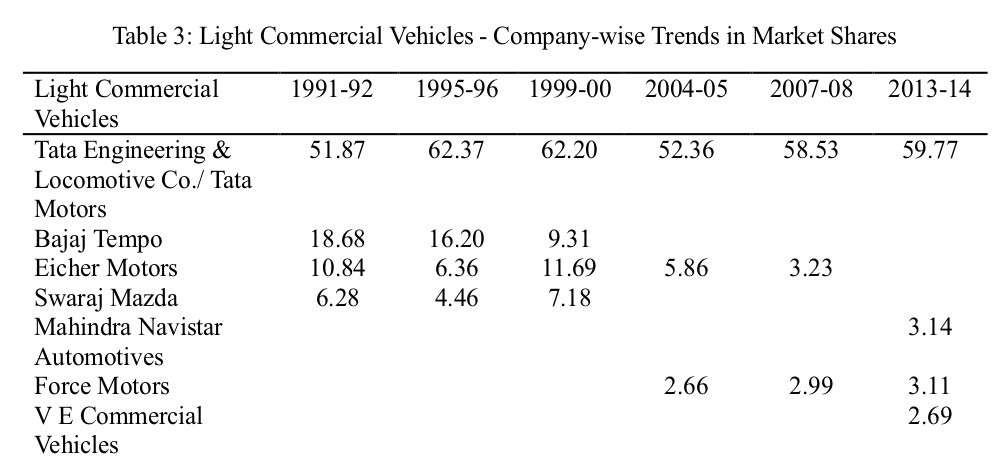
Light commercial vehicles are motor vehicles with at least four wheels, used for the carriage of goods. Mass given in tons (metric tons) is used as a limit between light commercial vehicles and heavy trucks. This limit depends on national and professional definitions and varies between 3.5 and 7 tons . In India this segment has consist 56.92 per cent of total commercial vehicles production volumes . In this segment too Tata Motors shows their muscles in total market share and maintain their first position over the years. The question arises why Tata Motors dominate in the light commercial vehicle? The answer is that Tata Motors serve the all latest facilities in their LCVs like launched rigid as well as tippers in their light trucks. The rigid trucks in the light commercial vehicle category (4 ton to 7.5 ton GVW) offer efficient solutions for transporting light cargo and the Tippers in the light commercial vehicle range are designed to deliver improved performance in the mining and construction industry . Thus, Tata Motors caters the demand of users as per their requirement, leads increase in their share in LCVs market. On the other hand Mahindra & Mahindra registered their presence in LCVs market and increasing market share year by year. Mahindra & Mahindra landed different models in LCVs in recent years like DI3200 CRX, Loadking Zoom 4&6 tyre and Loadking Tipper. With these different models it satisfies the demand of all kind of consumers and capture the LCVs market day by day. On the Bajaj Tempo, Eicher Motors, Daewoo Motors India and Ashok Leyland fail in to introduce the requisite LCVs model and lost their ground in this segment year by year.
Source: Author’s Own Calculations from CMIE Medium and Heavy commercial segment differentiate from other commercial vehicles segments on the basis of gross vehicle weight (GVW). GVW is defined as vehicle weight plus the rated payload; the rated payload being the maximum weight permitted to be loaded on to the vehicle under the Motor Vehicles Act, 1988. Vehicles with a GVW of 7.5-16 tonnes are classified as MCVs (ICRA 2009) . It is clear from table 4 before 2004 Tata Motors and Ashok Leyland were the leader in Medium and heavy commercial vehicle segment. After 2004-05 many other players like S M L Isuzu, Asia Motors Works, Man Force Trucks Pvt., and Mahindra Vehicle Mfrs. had launched their M&HVs. But still Tata Motors maintain their leadership in this segment and Ashok Leyland also maintains their second position in M&HVs.
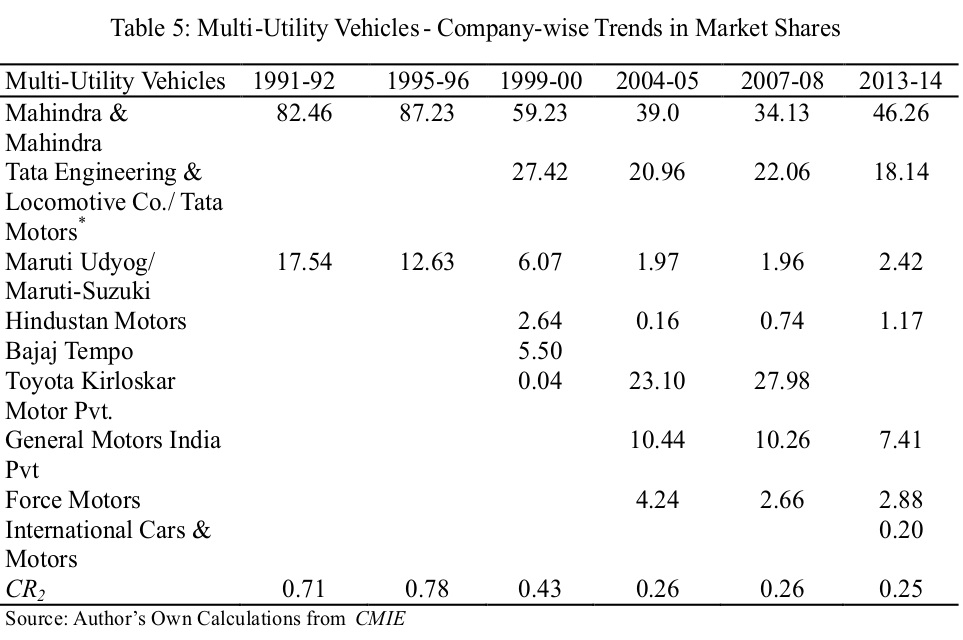
Multi Utility Vehicle or MUV class represents large bodied vehicles with at least 6 adult passengers capacity. Tata Sumo, Toyota Innova and Mahindra Bolero are examples in this segment. Primarily targeted at the rural population with the need to carry a number of passengers and luggage, this segment is equally popular with tourist operators. Equipped with frugal diesel engines, they are ubiquitous on the Indian roads . In case of MUVs, Mahindra & Mahindra cover more than 80 per cent of the market during 1991-92. But later on its market share decreases over the years and just remains 46.26 per cent in 2013-14. Besides decreasing in market share of MUVs, no doubt Mahindra & Mahindra still dominate the market with their large varieties and consumer loyalties. During 1999-2000 Tata Motors too join this market segment and snatched the share of Mahindra & Mahindra and Maruti Udyog. During the same year, some others player also join the MUVs market like Hindustan Motors, Bajaj Tempo and Toyota Kirloskar Motor Pvt., all these share the MUVs market due to this the competition rises and the share of dominant players i.e. Mahindra & Mahindra and Maruti Udyog declining year by year.
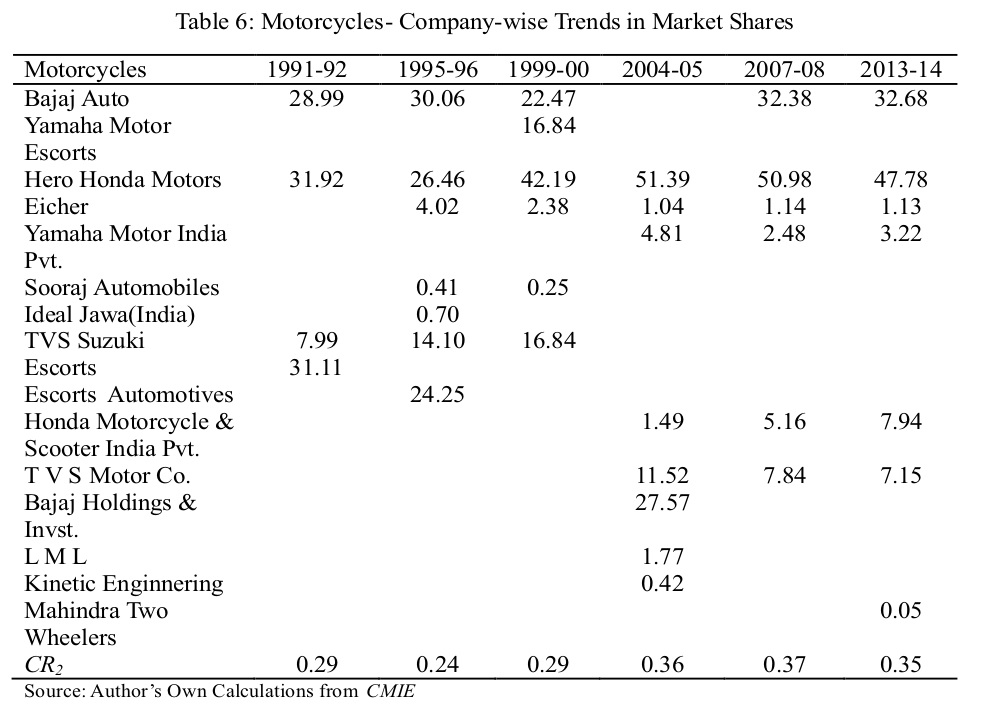
The Motorcycles segment is the very important segment of Indian automobile, and has more than 70 per cent market share in total automobile sales. This segment always lures the motorcycle manufacturers due to the poor and crowded roads of India. The motorcycles are the convenient means of transportation as per the conditions of roads, small and narrow streets and markets. Further, low per capita income suite the Indian consumers to purchase motorcycles. The motorcycle manufacturers are aware about these condition and many players enter in this market, due to rising of manufactures the competition raises from very beginning say 1991-92 to 2013-14. Individually Hero Honda Motors alone capture nearly 50 per cent of the motorcycle market in 2013-14. Whereas Bajaj Auto with the 32.68 per cent market share became the second strongest contender during the same year.
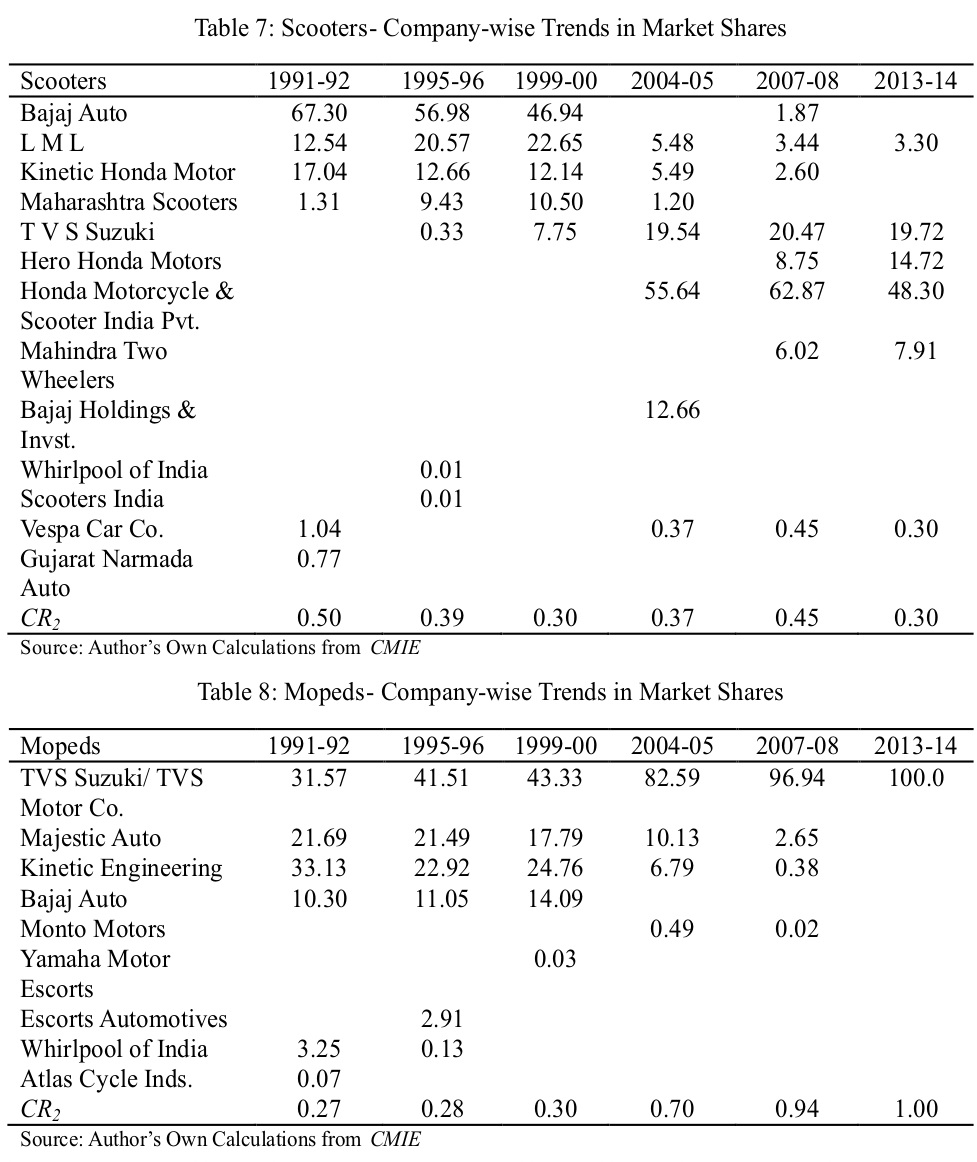
The Scooters and mopeds segment of India faced the high level of transformation. The light weight and low height scooters are become the substitutes of heavy weight scooters. With the introduction of light weight and fuel efficient scooters in Indian market, consumers prefer these than heavy weight Scooters. Due to this the heavy weight Scooters manufacturers either stop the production or switch their business to light weight and low height Scooters production after 2004-05. The main light weight and low height Scooters are TVS Wego, Jupitor, Suzuki Access, Hero Honda Pleasure and Honda Activa. The light weight and low height Scooters not affected the sale of heavy weight Scooter alone it also affected the mopeds market. The moped market nearly lost their existence after 2004-05 and only single manufacturer reaming in the segment i.e. TVS Motor Co.; and hold the whole market share. That is why TVS Motor Co. has the pure monopoly in mopeds segment in 2013-14.
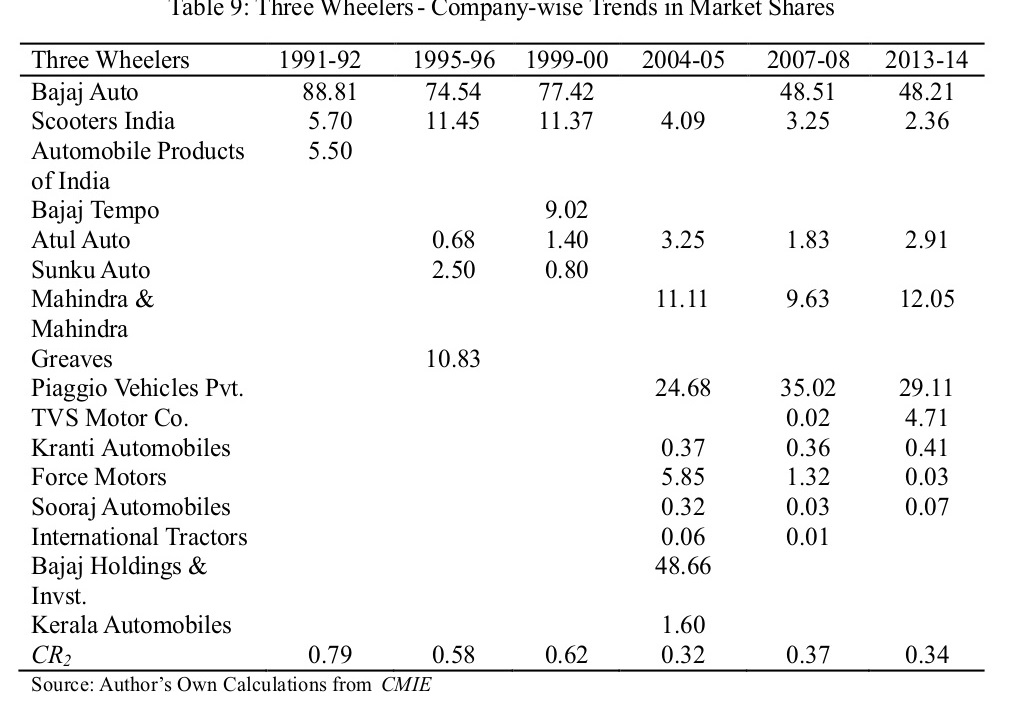
The three-wheeler segment of India was fall under the high concentration during 1991-92 i.e. 0.79 per cent and later on become competitive over the years. During 1991-92 Bajaj Auto hold nearly 90 per cent of market share. Due to entry of new players, the market share distributed among the new players and Bajaj Auto just remained 48.21 per cent market share. The Piaggio Vehicles Pvt. is the new rising star in the field of three-wheeler production, consisting 29.11 per cent share of this segment in 2013-14. After 2004 Mahindra & Mahindra realized its presence and holds more than 10 per cent share of the market.
On the basis of above these analysis the study found that the economic reforms of 1991 open the Indian shore for the rest of the world and the entry, exit and FDI restrictions dissolved which attract the foreign players. Due to entry of foreign players competition goes on increasing and the concentration ratio starts declining. After structural reforms of 1990s, number of firms increases year by year. This further leads competition in passenger cars segment and passenger cars concentration ratio remained half in 2013-14. However, when analyzed share in total sales at individual firm level. Maruti-Suzuki more or less maintains their dominancy in total passenger cars sales 68.77 and 42.47 per cent during 1991-92 and 2013-14 respectively. In Light commercial Vehicles segment Tata Motors maintain their market share and first position over the years with all latest facilities in their LCVs like launched rigid as well as tippers in their light trucks. On the other hand Mahindra & Mahindra registered their presence in LCVs market and increasing market share year by year. Medium & Heavy Commercial Vehicles reported decline in concentration ratio and moving towards competitive markets. Tata Motors and Ashok Leyland are the leader in Medium and heavy commercial vehicle segment. The three-wheelers segments transformed from a very high concentration oligopoly type (0.79 per cent) to a medium concentration oligopoly type (0.34 per cent). In case of Mopeds, due to falling demand, manufacturers shift to motor-cycles and scooter segments. In 2013-14, the TVS remained sole manufacturer of mopeds and the mopeds segment has achieved almost pure monopoly.
Barthwal, R. R. (2000). Industrial Economics. New Age International. New Delhi. Scitovsky, T. (1955). Economic theory and the measurement of concentration. In Business concentration and price policy (pp. 101-118). Princeton University Press. Evely, R., & Little, I. M. D. (1960). Concentration in British Industry. Cambridge University Press. George, S., Jha, R., & Nagarajan, H. K. (2002). The evolution and structure of the two-wheeler industry in India. International Journal of Transport Economics/Rivista internazionale di economia dei trasporti, 63-89. ICRA (2009). Methodology for Rating Commercial Vehicle Manufacturers. ICRA Rating Feature, ICRA Limited, New Delhi Web. https://www.icraresearch.in/Home/GetMethodologyPdf/369 KPMG (2010). The Indian Automotive Industry Evolving Dynamics. Web. https://www.kpmg.de/docs/Auto_survey.pdf Kumar N., & Kuldip K. (2014). Some Aspects of Indian Automobile Industry- An Analysis. Social Vision, 3: 247-252. Mukherjee S., & Chakrabarti J. (2000). Evolution of Indian Economy & Elementary Statistics. Allied Publishers Limited, Mumbai Ranawat, M., & Tiwari, R. (2009). Influence of government policies on industry development: The case of India's automotive industry. Ranawat M., & Tiwari R. (2009). Influence of Government Policies on Industry Development: The Case of India’s Automotive Industry. Research Project Global Innovation, Working Paper No. 57, Hamburg University of Technology, Germany Vakil, C. N. (1973). Concentration of Economic Power-Monopoly Houses. In CN Vakil (ed) Industrial Development of India- Policy and Problems, Orient-Longman, New Delhi White, L. J. (2015). Industrial concentration and economic power in Pakistan. Princeton University Press.

