|
OswinAganda Anaba School of Management Jiangsu University, Zhenjiang 212013, China Email:mzq@ujs.edu.cn, mingxingli6@163.com,1730405863@qq.com Bolgatanga Polytechnic, Box 767, Bolgatanga Ghana Email: oswinaganda@yahoo.com,benasunka@bpoly.edu.gh |
Ma Zhiqiang School of Management Jiangsu University, Zhenjiang 212013, China |
Li Mingxing School of Management Jiangsu University, Zhenjiang 212013, China |
Li Mingxing School of Management Jiangsu University, Zhenjiang 212013, China Bolgatanga Polytechnic, Box 767, Bolgatanga Ghana |
In analyzing an enterprise’s potential for investment and growth, it is significant to study its financial performance from a different angle.Efficiency measuring and analyzing has become a vital problem in modern enterprise managementsince financing is said to be the main way for listed companies to acquire funds in China, and it is a panacea which can guarantee enterprises to function continuously. This paper evaluates the financing efficiency of listed military and civilian integratedenterprises in Jiangsu, Zhejiang, and Shanghai. Taking 30 listed military and civilian integrated enterprises, the paper uses Data Envelopment Analysis (DEA) method to evaluate the financial efficiencies by considering technical efficiency, return to scale and improvement policy for the period of 2012–2016. The results suggest that the financing efficiency of the listed enterprises were generally low, showing a trend of decreasing returns to scale in the first instance and then started to show an increasing return to scale. The findings also revealed that the scale efficiency value of most sample enterprises was far higher than its pure technical efficiency value, making the pure technical efficiency the main cause for the low technical efficiency. The relationship between the financing efficiency level of each sample enterprise and the overall level of the enterprise has two cases of synchronous change and deviation from development.
KEYWORDS: Military-Civil Integration Enterprise; Financing Efficiency; DEA Model; Improvement Policy
Thestride of China’seconomic evolution and industry transformation is continuously accelerating through the development of market economy, which has become an invisible and powerful force enhancing the growth of modern enterprises. Over the years, China has made its own efforts to “catch up” (at all costs) to the other developed nations. The latest attempt was to build a domestic National Defense integration where the government is promoting integration between the military and the civilian sectors (Lin, 2017). The link between the military and civilian development of modern science and technology is becoming more and more positive. The development of military-civilian integration has now become the novelglobal trend that corresponds to the main theme for peace. According to statistics, 80% of the methods utilized in the military information system of UK and US comes from civilian information system (Shangfen, 2014). The government of China has also come up with the strategy of developinga deep military-civilianintegration. National Defense integration has, therefore, become significant in the acceleration of growth of weapons and equipment and the development of modern science and technology industry. The integration of military and civilian enterprises bears the important task of National Defense in scientific research and production. They are engaged in providing all kinds of weapons, equipment development and production activities for the National Armed Forces. The 17th China’s People Congress (CPC National Congress) proposed a decision for the development of military and civilian integration with Chinese characteristics. The report of the 18th CPC National Congress pointed out: To adhere to the integrated military and civilian development with Chinese features and to strengthen the strategic planning, institutional mechanism and legal construction for the integration of military and civilian development. The 19th General Session of the Party once again emphasized on the unity of rich and strong forces to form a deep development pattern of military and civilian integration. It can be seen that military and civilian integration enterprises are playing an increasingly important role in China's national strategy. Even though the integration strategy is very important, the risk runs high for the Chinese private firms entering into the defense contracting business. High access costs along with the peril of losing autonomy avert enterprises from entering into the defense market. Though in theory, military-civilianintegration intends to offer the private sector a greater role in defense contracting business, well established state-owned enterprises (SOEs) with years of experience in defense-related research and development (R&D), crowd out the private sector enterprises. That is why it has become very essential to look into the financial efficiency of these integrated enterprises. Against this background, it has become apposite to measure the level of relative (in)efficiency of these listed military and civilian integration enterprises and to explore the areas for bringing an improvement in their efficiency. Further, it is momentous to divulge whether the experiential inefficiency in these enterprises is due to managerial underperformance or choice of inapt scale size. In this paper, DEA model is used to conduct an all-around evaluation of the financing efficiency of military and civilian integration enterprises in Jiangsu, Zhejiang, and Shanghai from the period of 2012-2016 by considering three dimensions of enterprise that include efficiency, returns to scale and improvement policy. The study is organized as follows: Section 2 provides a comprehensive review of literature. Section 3 presents the proposed methodology and provides an overview of the model variables. Section 4 reports the results of the DEA model. Section 5 discusses the findings and section 6 summarizes and concludes with some suggestions.
The new movement for Chinese military-civilian relations is powered by China’s growing economic supremacy and by civilians directly contributing in China’s military strategies.There has been an increased number of studies on the integration of the military in various economies. Amongst them, Tao (2015) studied the impact of the technology transfer and knowledge accumulation mechanism of military and civilian integration enterprises on the competitiveness and sustainable growth of military and civilian integrated enterprises and discussed the ways of enhancing the knowledge structure of military and civilian integration enterprises. Liu Min and Haojie (2016) used the DEA-Malmquist production index method to compare and analyze the operational efficiency of state-owned enterprises and civil participation enterprises in the listed military enterprises, and put forward the difficulties in the development process of military enterprises.Wang Bai-jie and Ai-wen (2016)selected the panel data of 63 listed Enterprises in China's top ten "industrial groups" from 2005 to 2014, and used the stochastic frontier analysis method and the least-squares virtual variables (LSDV) analysis to calculate the technical efficiency and the issues affecting the technical efficiency of China's military and civilian integrated enterprises respectively. From internal and external synergies of military and civilianintegration of intellectual property management. Tan (2016) studied the ideal structure of collaborative intellectual property management of military and civilian integration enterprises based on the theory of cross-integration and innovation sources.Yuan (2016) analyzed the ideological obstacles, institutional obstacles, standard obstacles, privacy barriers and intellectual property blocks that exist in the integration of military and civilians, and established an information sharing game model of military-civilian integration and innovation. From the perspective of improving the utility, willingness and maximum benefits of information sharing proposed governance strategy. In view of the duality of military and civiliansubjects and asymmetry in assets, technology, and personnel, Long (2017) proposed the integration of civilians to promote the symbiotic development of National Defense and economic growth through sound regulatory policies, reforming institutional mechanisms and other measures. Zhao, Sun, and Zhang (2017) applied a differential game model to study the technology sharing between military enterprises and civil enterprises in the military-civilian collaborative innovation system. The idealtactics of both parties were investigated from Nash non-cooperation game, Stackelberg game, and cooperative game.Huang Xichuan and Tianyi (2017)applied analytic hierarchy process and fuzzy comprehensive evaluation technique to build a model to evaluate the innovation capability of high-technology industrial groups with military and civilian integration. An empirical study was conducted on five industrial arrays with military and civilian integration in Jiangsu Province. According to the research results, the quality of science and technology intermediary affected service quality. In conclusion, the research works done on the integration of military and civilian enterprises mainly focused on the following fields: the competitiveness of enterprises, the productivity of enterprises, the profitability of enterprises, the development capability of enterprises, the growth capacity of enterprises and the efficiency of enterprises. The research methods adopted mainly include DEA model, Tobit regression model, DEA-Malmquist production index method, the stochastic frontier model, game model and so on. This paper, therefore, makes use of the DEA model to conduct an all-around evaluation of the financing efficiency of military and civilian integration enterprises in Jiangsu, Zhejiang and Shanghai provinces from 2012-2016 from the dimensions of efficiency, returns to scale and improvement policy.
Data envelopment analysis (DEA) is a decisional method that has been extensively employed for performance analysis in private and public sectors(Koltai & Uzonyi-Kecskés, 2017; Rabar, 2017).The measurement efficiency of DEA model is an objective evaluation based on Pareto's effective concept. Compared with SFA, DEA has unique advantages in the model application and index processing. DEA is the terminology created in the operations research literature by Charnes, Cooper, and Rhodes (1978) (CCR) to measure the technical efficiency of a given observed decision-making unit (DMU) adopting constant returns to scale. Their linear programming formulation permitsmultiple inputs and multiple outputs. This study chose to adopt DEA (Charnes et al., 1978) instead of parametric methods to estimate technical and scale efficiency for the following reasons: DEA methodology is able to handle multiple input and multiple output models; it does not need an assumption of a functional method involving inputs to outputs; decision making units (listed military and civilian integration enterprises) are directly compared against a peer or combination of peers; and inputs and outputs can have very different units of measurement(Coelli, Rao, O'Donnell, & Battese, 2005). The CCR and BCC models were considered because we assume a constant return to scale (CRS) or CCR relationship between the input and output values, where the size of the input does not affect the marginal change of output. Therefore, when the effect of a unit change in input is not constant then a variable return to scale (VRS) or BCC relationship is assumed(Cooper, Seiford, & Zhu, 2004). The two most important group of efficiency measures in DEA are the radial measures and the non-radial measures. Radial measures are applied, for example, in the cases of CCR and BCC models, whereas non-radial measures are applied in the case of slacks-based measure (SBM) models(Tone & Tsutsui, 2017).The radial models provide information about the proportional change of all inputs and all outputs. It is assumed that all inputs and all outputs must be decreased or increased by the same proportion. Thus, this study adopts the radial measures by making use of the CCR (CRS) and BCC (VRS) models.The DEA methodology has been usedseverally in developing countries and to a minor extent in a few developed countries to analyze efficiency ofenterprises. In this DEA model, the decision-making unit contains an input variable X (assuming m inputs) and an output vector Y (assuming s outputs). Its linear programming is as follows: Suppose nDMU (DMUj: j = 1, 2 ..., n) using m input variablesXij (i = 1, 2, ... n) and thus the resulting outputYrj(r = 1, 2 ..., s). According to the two different assumptions, the DEA method can be divided into Constant Return to Scale (CRS) model and Variable Return to Scale (VRS) model. The CRS model is suitable for the evaluation of the relative validity of decision-making units (DMU) based on the hypothesis of constant returns to scale. The VRS model is applicable to the evaluation of the relative validity of DMU under the hypothesis of variable returns to scale.
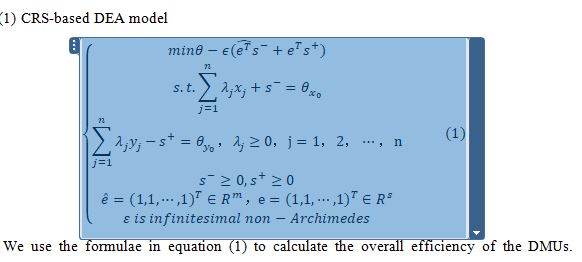
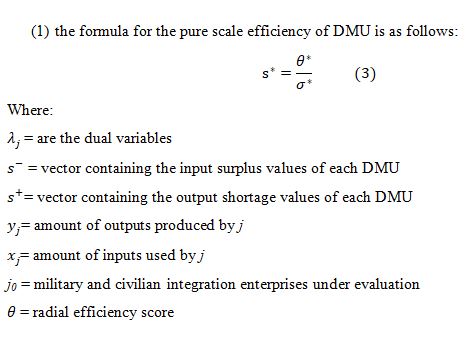
We use the formulae in equation (1) to calculate the overall efficiency of the DMUs. Suppose the optimal solution of equation (1) is:λ^*,s^(*-),s^(*+),θ^*. According to Wang Xinyu's evaluation of the operating efficiency of urban department store retailers based on DEA model (Xinyu, 2001), we can see: (a) If θ^*=< 1 with non-zero slacks indicate thatDMU_j0is inefficient, but if θ^*=1, and s^(*-)= 0,s^(*+)= 0 then DMU_j0is now efficient. We can project this DMU onto the efficient frontier by using the optimal values from Equation (1) in order to obtain the improved activity, thus make(x_0 ) ̂=θ^* x_0-s^(*-),(y_0 ) ̂=y_0- s^(*+), then the projection on the efficient frontiers is valid (overall) relative to the original n DMU. (b) If it is established that ∑_(j=1)^n▒〖λ_j〗^* =1 where 〖λ_j〗^* (1,2,⋯,m), of DMU_j0 then there will be a constant return to scale. If it established that ∑_(j=1)^n▒〖λ_j〗^* <1 where 〖λ_j〗^* (1,2,⋯,m), of〖 DMU〗_(j0 )then there will be an increasing return to scale. If it established that ∑_(j=1)^n▒〖λ_j〗^* >1 where 〖λ_j〗^* (1,2,⋯,m), of DMU_j0 then there it will be a decrease returns to scale.
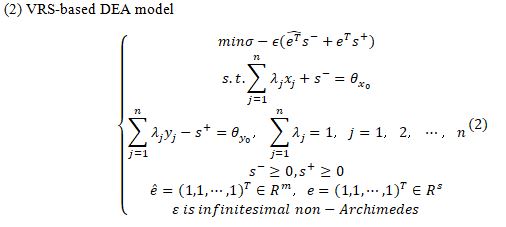
We use the formulae in equation (2) to calculate the pure technical efficiency of the DMUs and the ideal solution of equation (2) isλ^*,s^(*-),s^(*+),σ^*. According to the literature, we notice that: (a) Ifσ^*=>1, and non-zero slacks indicate that〖 DMU〗_j0is inefficient (pure technical is inefficiency) but if σ^*=1 and s^(*-)=0,s^(*+)=0 , thenDMU_j0 , is efficient for DEA (pure technical efficiency).
The sample data source of this paper was retrieved from the GTA CSMAR database selected from 2012 to 2016 financial data of the listed military and civilian integration enterprises in Jiangsu, Zhejiang and Shanghai Provinces in China. In considering the validity of the data, we excluded 30 enterprises that were merged by military and civilian sectors at the time of the study period (2012-2016) and finally selected 30 sample enterprises, with a total of 150 observations.
Based on the principles of scientific, comparability and accessibility, this paper selects the indexes and normalizes some indexes with negative numbers. The normalization was done to take care of the missing values within some of the years and were supplemented by the current years’ moving average, to eliminate the original data with 0 value caused by the operation failure. The normalization did not however, affect the results. According to the existing research results on the efficiency of corporate finance(Xiu-Zhen, Hui-Ping, & Yi, 2017), an evaluation index system for the efficiency of the financing of military and civilianintegration is proposed (Table 1).
|
Category |
First level indexes |
Second level indexes |
Description |
|
Input variable |
Capital acquisition capacity |
Asset-liability ratio |
Reflects the creditworthiness ofthe enterprise |
|
Main business cost |
The Business cost includes all the costs (fixed, variable, direct, indirect) incurred in carrying out the operations of the business. |
||
|
Total assets |
Reflect the scale of enterprise |
||
|
Output variable |
Ability to use funds |
Net asset profit |
Total assets minus total liabilities |
|
Total asset turnover |
Comprehensive evaluation of the operatingquality and efficiency of all the assets of anenterprise |
||
|
Life cycle |
Main business growth rate |
The rate by which a variable increase over a stated period of time as a percentage of its preceding value |
Based on the average of technical efficiency (TE), pure technical efficiency (PTE) and scale efficiency (SE) of Jiangsu, Zhejiang, and Shanghai military and civilian integration enterprises, the overall financing results of efficiency are abridged below in Table 2. The average efficiency of the 30 listed Enterprises in Table 2 shows that the results of the average pure technical efficiency (PTE) and the average scale efficiency (SE) in all the provinces revealed a decreasing trend in the first instance but later on started increasing slightly. The annual average of the TE, PTE and SE with scores of 0.4661, 0.5279 and 0.8744, respectively showed that 53.39% of the resources of the sample businesses were being wasted thus inefficient. This indicates that the entire level of financing efficiency of the enterprises is low.
Table 2: Annual Average Efficiency of the 30 Listed Enterprises|
Efficiency average |
2012 |
2013 |
2014 |
2015 |
2016 |
Annual average |
|
TE |
0.5614 |
0.4425 |
0.4158 |
0.4578 |
0.4532 |
0.4661 |
|
PTE |
0.6098 |
0.5269 |
0.4702 |
0.5137 |
0.5189 |
0.5279 |
|
SE |
0.9028 |
0.8404 |
0.8559 |
0.8649 |
0.9078 |
0.8744 |
To further describe the financing efficiency of the integration of listed Enterprises, results from Table 3 showed some fluctuating percentages ranging from 6.67% to 20% of the technical efficient enterprises. Likewise, the results of the technical inefficient enterprises also fluctuated in the ranges of 80% to 93.33%. In addition, the PTE also revealed an unstable range of 13% to 23%, whiles its inefficiencies ranged between 76.67% to 86.67%. The efficient enterprises for the scale efficiency also accounted for an unstable percentage result ranging from 6.67% to 23.33%. The percentage of enterprises with inefficient SE fluctuated from 76.67% to 93.33%. In carefully observing the findings of the study, the instability of technical efficiency value and scale efficiency value of the enterprises was relatively high, and the pure technical efficiency value was relatively low. The percentage of (in)efficient enterprises with showed a mixture of decreasing and increasing percentages and the percentages were all lower than 24%, which was much lower than the inefficient enterprises. In summary, the overall financing efficiency of the listed enterprises of Jiangsu, Zhejiang, and Shanghai in the 2012 – 2016 study period was relatively low. The results are in Table 3 and Table 4.
Table 3: Financing Efficiency of the 30 Listed Enterprises 2012 – 2016 (Jiangsu, Zhejiang, and Shanghai)|
|
TE |
PTE |
SE |
||||||||||||
|
2012 |
2013 |
2014 |
2015 |
2016 |
2012 |
2013 |
2014 |
2015 |
2016 |
2012 |
2013 |
2014 |
2015 |
2016 |
|
|
Efficient DEA |
6 |
3 |
2 |
6 |
2 |
7 |
5 |
4 |
7 |
6 |
7 |
3 |
2 |
6 |
3 |
|
Percentage |
20 |
10 |
6.67 |
20 |
6.67 |
23 |
16 |
13 |
23 |
20 |
23 |
10 |
6.67 |
20 |
10 |
|
Inefficient DEA |
24 |
27 |
28 |
24 |
28 |
23 |
25 |
26 |
23 |
24 |
23 |
27 |
28 |
24 |
27 |
|
Percentage |
80 |
90 |
93.33 |
80 |
93.33 |
76.67 |
83.33 |
86.67 |
76.67 |
80 |
76.67 |
90 |
93.33 |
80 |
90 |
Table 4 depicts the changes in the returns to scale of the sample enterprises. In general, the number of enterprises with increasing returns to scale was relatively high in each year than enterprises with constant returns to scale and decreasing returns to scale, except for 2016 where the decreasing return to scale and the increasing return to scale of the enterprises had the same value (14). In total, the number of enterprises with increasing returns to scale (95) far exceeded the number of enterprises with a constant return to scale (19) and decreasing returns to scale (36). However, the number of enterprises with decreasing returns to scale during the 2013-2016 study period showed an increasing trend. But that was not the same for the enterprises with increasing return to scale which showed a decreasing flow after 2013. The table, in summary, shows that a combined majority (95) of the listed enterprises from 2012 to 2013 in the three provinces depicted a slightly high financial efficiency even though there was a decline in the increasing return to scale.
|
Years |
Constant return to scale |
Decreasing return to scale |
Increasing return to scale |
|||
|
Number of Enterprises |
Percentage |
Number of Enterprises |
Percentage |
Number of Enterprises |
Percentage |
|
|
2012 |
6 |
20 |
5 |
16.67 |
19 |
63.33 |
|
2013 |
3 |
10 |
3 |
10 |
24 |
80 |
|
2014 |
2 |
6.67 |
6 |
20 |
22 |
73.33 |
|
2015 |
6 |
20 |
8 |
26.67 |
16 |
53.33 |
|
2016 |
2 |
6.67 |
14 |
46.67 |
14 |
46.67 |
In order to effectively analyze the reasons of the difference in financing efficiency between the listed Enterprises in Jiangsu, Zhejiang, and Shanghai, the paper summarizes the technical efficiency (TE), pure technical efficiency (PTE) and scale efficiency (SE) of the 30 sampledEnterprises during the 2012 – 2016study period.
Efficiency is the complete assessment of resource allocation capability and resource utilization efficiency of each DMU. A combination of Table 2 and Table 5 show that 40% of the sample enterprises had their technical efficiency score lower than that of the overall technical efficiency, thus, the level of efficiency was far below the overall technical efficiency of the enterprises.Alternatively, the percentage of enterprises with technical efficiencies higher than the overall technical efficiency was about 26.67%. The resulting changes of the sample enterprises with high technical efficiency were about 33.33%. However, about 30% of the sample enterprises have had their values above the scale efficiency of the overall scale of enterprises. Moreover, 61.29% of sample enterprises had their scale efficiency values fluctuating between the range of 0.65 to 1, except the instability of 6 sample enterprises (serial numbers 1, 14, 16, 18, 22, 26) whose scale efficiency values fell below 0.6. In addition, the technical efficiency, pure technical efficiency and scale efficiency of 4 sample enterprises (serial numbers 15, 21, 27, 29) were above the corresponding total efficiency value, and 3 (serial numbers 15, 21, 27) out of the 4 sample enterprises’ efficiency values were close to or equal to 1 yearly. In the years of 2012–2015, nearly half of the listed enterprises in the three provinces shared a trend of an unstable (decreasing and increasing) values in relation to technical efficiency and pure technical efficiency, which was similar to the overall technical efficiency and pure technical efficiency of the sample enterprises. In that same period, the scale efficiency of most of the sample enterprises was higher than that of their pure technical efficiency and far higher than their technical efficiency values. This indicates that majority of the sample enterprises have low pure technical efficiency values causing their technical efficiency values to be low. However, the technical efficiency and pure technical efficiency values of the military and civilian enterprises between 2015 to 2016 converged steadily. Moreover, among the 30 sampled enterprises, 46.67% and 50% of the technical efficiency values and pure technical efficiency values respectively were seen to be stable. However, 66.67% of the technical efficiency values and 56.67% of pure technical efficiency values were seen not be increasing. Once again, except for 5 sample enterprises (serial numbers 14, 18, 24, 25 and 26), the scale efficiency values of the other sample enterprises gradually kept on increasing till they basically reached 1 in 2016, while the pure technical efficiency values were still far less than 1. Almost half of the technical efficiency values of sample enterprises showed an increasing tendency during the study period. During the 2015-2016 study period, the pure technical inefficiencies values remained the main cause inhibiting the sample enterprises technical efficiencies.
From the perspective of the enterprise, measuring the changes in scale returns will help enterprises find financing that matches their development scale, so as to make appropriate financing decisions so that financing can be fully utilized and ultimately raise the financing efficiency. This paper analyzes the scale returns of each decision-making unit through the analysis of returns to scale and further analyzes the reasons for the low financing efficiency of decision-making units in the integration of listed enterprises in Jiangsu, Zhejiang, and Shanghai. Basically, when all the factors of production are expanded in the same quantity, thus, when the frequency of increase in output is more than the frequency of increase in factors of production, the enterprise is in a state of increasing returns to scale. This demonstrates that there is room for further increase in the enterprise's production inputs. Alternatively, when the frequency of increase in output is below the frequency of increase in factors of production, then enterprises are in the state of diminishing returns to scale, indicating that when the production scale expands to an extent, the enterprises cannot realize the full utilization of funds due to technical level and management issues, resulting in the decrease of financing efficiency of enterprises. It can be settled from Table 5 that in the study period of 2012-2016, the number of enterprises with Sum Lambda values less than 1 was high, that is, most of the military and civilian enterprises in Jiangsu, Zhejiang, and Shanghai were in an increasing return to scale. 20% of the sample enterprises have been in a state of increasing return to scale except for six enterprises (serial numbers were 1, 6, 9, 18, 19, 22) with annual Sum Lambda (SL) values was less than 1, but the other enterprises’ return to scale have been changing. In addition to the above, 33.33% of the sampled enterprises have had an increasing return to scale values from 2012-2015 study period. Moreover, enterprises (21 and 27) have maintained their returns to scale. The position of the scale income has been increasing at 30%, decreasing at 33.33% and maintained its consistency at 3.33% between 2015 to 2016. However, in 2016, the percentage of sample enterprises with a decreasing return to scale reached the highest level, accounting for about 46.67%.
Whether a company can make complete use of the funds it receives and whether the projects it implements can achieve the highest expected returns has a direct influence on the financing efficiency of the enterprises. In the circumstance of enterprises, choosing the right capital for investment will be conducive to the efficient use of funds and the efficient distribution of resources. Through the improvement policy, we can further explore the resource allocation efficacy of inefficient decision-making units in Jiangsu, Zhejiang, and Shanghai military and civilian integration enterprises, and discover the main reasons that lead to the inefficient decision-making units. For an enterprise to be considered efficient in investments the rates of improvement in inputs should be more than zero (0). On the other hand, if the enterprise’s input is less than 0, it suggests that under the existing level of output the enterprise has not been able to fully utilize the value of the inputs, thus, causing input inefficiency. Likewise, if the rate of improvement of the output index of the enterprise is more than zero (0), then there is a decline in the outputs of the enterprise which suggests that in the existing input levels there is more room for the augmentation in the output levels of the enterprise. Hence, the higher the improvement of the output index, the possibility for an increase in output. The results are in Table 5.
|
Enterprise serial number |
Efficiency |
2012 |
2013 |
2014 |
2015 |
2016 |
|
1 |
TE |
0.1380 |
0.1124 |
0.0771 |
0.0700 |
0.2448 |
|
PTE |
0.1522 |
0.1406 |
0.1406 |
0.1525 |
0.2451 |
|
|
SE |
0.9067 |
0.7994 |
0.5483 |
0.4590 |
0.9987 |
|
|
SL |
0.6650 |
0.6880 |
0.5130 |
0.4370 |
0.9680 |
|
|
RTS |
+ |
+ |
+ |
+ |
+ |
|
|
2 |
TE |
0.3873 |
0.2183 |
0.1979 |
0.3308 |
0.1782 |
|
PTE |
0.4156 |
0.3083 |
0.2304 |
0.4544 |
0.1895 |
|
|
SE |
0.9309 |
0.6858 |
0.8552 |
0.7279 |
0.9403 |
|
|
SL |
0.7810 |
0.6350 |
0.7510 |
1.3200 |
0.8800 |
|
|
RTS |
+ |
+ |
+ |
- |
+ |
|
|
3 |
TE |
0.3588 |
1 |
0.3241 |
0.3478 |
0.3291 |
|
PTE |
0.3624 |
1 |
0.3285 |
0.3491 |
0.3291 |
|
|
SE |
0.9900 |
1 |
0.9866 |
0.9962 |
1 |
|
|
SL |
1.1090 |
1 |
0.9080 |
0.9590 |
0.9890 |
|
|
RTS |
- |
—— |
+ |
+ |
+ |
|
|
4 |
TE |
0.4486 |
0.8335 |
0.4674 |
0.5156 |
0.5095 |
|
PTE |
0.6756 |
1 |
0.5052 |
0.5584 |
0.5284 |
|
|
SE |
0.6640 |
0.8335 |
0.9251 |
0.9233 |
0.9642 |
|
|
SL |
0.6520 |
1.5320 |
0.7960 |
1.0600 |
1.2500 |
|
|
RTS |
+ |
- |
+ |
- |
- |
|
|
5 |
TE |
0.1886 |
0.0839 |
0.0841 |
0.1504 |
0.0963 |
|
PTE |
0.1886 |
0.0877 |
0.0952 |
0.1550 |
0.0980 |
|
|
SE |
1 |
0.9566 |
0.8834 |
0.9703 |
0.9826 |
|
|
SL |
0.9940 |
0.7080 |
0.6730 |
1.0670 |
0.9080 |
|
|
RTS |
+ |
+ |
+ |
- |
+ |
|
|
6 |
TE |
0.2184 |
0.1162 |
0.1011 |
0.0901 |
0.0648 |
|
PTE |
0.2284 |
0.1491 |
0.1300 |
0.1276 |
0.0698 |
|
|
SE |
0.9562 |
0.7793 |
0.7717 |
0.7061 |
0.9283 |
|
|
SL |
0.9030 |
0.6930 |
0.6880 |
0.6340 |
0.8730 |
|
|
RTS |
+ |
+ |
+ |
+ |
+ |
|
|
7 |
TE |
0.6741 |
0.3950 |
0.3588 |
0.2578 |
0.5435 |
|
PTE |
0.6915 |
0.5476 |
0.5513 |
0.4066 |
0.5729 |
|
|
SE |
0.9748 |
0.7213 |
0.6508 |
0.6340 |
0.9486 |
|
|
SL |
0.9450 |
0.6460 |
0.6090 |
0.5790 |
1.2260 |
|
|
RTS |
+ |
+ |
+ |
+ |
- |
|
|
8 |
TE |
0.2948 |
0.2164 |
0.3026 |
0.1838 |
0.2407 |
|
PTE |
0.3028 |
0.2299 |
0.3016 |
0.2093 |
0.2417 |
|
|
SE |
0.9735 |
0.9412 |
0.9711 |
0.8781 |
0.9958 |
|
|
SL |
1.2250 |
0.8760 |
1.5120 |
0.7830 |
0.8660 |
|
|
RTS |
- |
+ |
- |
+ |
+ |
|
|
9 |
TE |
0.2847 |
0.2569 |
0.2351 |
0.2413 |
0.2622 |
|
PTE |
0.4543 |
0.3736 |
0.3276 |
0.3027 |
0.2764 |
|
|
SE |
0.6266 |
0.6876 |
0.7176 |
0.7971 |
0.9486 |
|
|
SL |
0.5410 |
0.5860 |
0.6020 |
0.6710 |
0.8760 |
|
|
RTS |
+ |
+ |
+ |
+ |
+ |
|
|
10 |
TE |
0.5388 |
0.4834 |
0.4101 |
0.3309 |
0.4242 |
|
PTE |
0.5584 |
0.5485 |
0.4347 |
0.3303 |
0.4269 |
|
|
SE |
0.9649 |
0.8813 |
0.9434 |
0.9987 |
0.9936 |
|
|
SL |
0.8640 |
0.8110 |
0.9220 |
0.9900 |
1.0810 |
|
|
RTS |
+ |
+ |
+ |
+ |
- |
|
|
11 |
TE |
0.0792 |
0.0471 |
0.0396 |
0.0547 |
0.1755 |
|
PTE |
0.0797 |
0.0633 |
0.0633 |
0.0728 |
0.1762 |
|
|
SE |
0.9937 |
0.7440 |
0.6255 |
0.7513 |
0.9960 |
|
|
SL |
0.9540 |
0.6520 |
0.5430 |
0.5440 |
1.4680 |
|
|
RTS |
+ |
+ |
+ |
+ |
- |
|
|
12 |
TE |
0.6466 |
0.5655 |
0.7597 |
1 |
0.9491 |
|
PTE |
0.6741 |
0.6130 |
1 |
1 |
0.9545 |
|
|
SE |
0.9592 |
0.9225 |
0.7597 |
1 |
0.9943 |
|
|
SL |
0.9350 |
1.0520 |
1.2050 |
1 |
0.9020 |
|
|
RTS |
+ |
- |
- |
—— |
+ |
|
|
13 |
TE |
1 |
0.3016 |
0.1672 |
0.2330 |
0.4758 |
|
PTE |
1 |
0.4115 |
0.3259 |
0.3089 |
0.5097 |
|
|
SE |
1 |
0.7329 |
0.5130 |
0.7309 |
0.9334 |
|
|
SL |
1 |
0.6850 |
0.4720 |
0.5750 |
1.6050 |
|
|
RTS |
—— |
+ |
+ |
+ |
- |
|
|
14 |
TE |
0.6774 |
0.4529 |
0.4685 |
0.5869 |
0.4826 |
|
PTE |
0.7139 |
0.5641 |
0.5494 |
0.5961 |
1 |
|
|
SE |
0.9488 |
0.8028 |
0.8527 |
0.9845 |
0.4826 |
|
|
SL |
1.1040 |
0.7220 |
0.7740 |
0.9290 |
1.2100 |
|
|
RTS |
- |
+ |
+ |
+ |
- |
|
|
15 |
TE |
1 |
0.9225 |
0.9223 |
1 |
0.8427 |
|
PTE |
1 |
0.9865 |
0.9462 |
1 |
0.9114 |
|
|
SE |
1 |
0.9351 |
0.9747 |
1 |
0.9246 |
|
|
SL |
1 |
0.8990 |
0.9120 |
1 |
1.1490 |
|
|
RTS |
—— |
+ |
+ |
—— |
- |
|
|
16 |
TE |
0.5788 |
0.2647 |
0.4017 |
0.5872 |
0.3969 |
|
PTE |
0.7014 |
0.6180 |
0.4478 |
0.6610 |
0.4173 |
|
|
SE |
0.8252 |
0.4283 |
0.8970 |
0.8883 |
0.9511 |
|
|
SL |
0.7880 |
0.2980 |
0.8500 |
1.2650 |
0.9040 |
|
|
RTS |
+ |
+ |
+ |
- |
+ |
|
|
17 |
TE |
0.2251 |
0.1660 |
0.1594 |
0.1474 |
0.1743 |
|
PTE |
0.2690 |
0.1706 |
0.1758 |
0.1536 |
0.1751 |
|
|
SE |
0.8368 |
0.9730 |
0.9067 |
0.9596 |
0.9954 |
|
|
SL |
1.1780 |
1.0230 |
1.0720 |
0.8590 |
0.8930 |
|
|
RTS |
- |
- |
- |
+ |
+ |
|
|
18 |
TE |
0.9164 |
0.5937 |
0.7025 |
0.3259 |
0.1968 |
|
PTE |
1 |
0.9903 |
0.9221 |
0.4959 |
0.5446 |
|
|
SE |
0.9164 |
0.5995 |
0.7618 |
0.6571 |
0.3613 |
|
|
SL |
0.7090 |
0.5630 |
0.5930 |
0.5620 |
0.2720 |
|
|
RTS |
+ |
+ |
+ |
+ |
+ |
|
|
19 |
TE |
0.4800 |
0.1775 |
0.0985 |
0.2797 |
0.2465 |
|
PTE |
0.5082 |
0.2550 |
0.1369 |
0.2805 |
0.2487 |
|
|
SE |
0.9445 |
0.6960 |
0.7195 |
0.9971 |
0.9911 |
|
|
SL |
0.8930 |
0.5620 |
0.6880 |
0.9080 |
0.9600 |
|
|
RTS |
+ |
+ |
+ |
+ |
+ |
|
|
20 |
TE |
0.3966 |
0.3040 |
0.3036 |
0.2813 |
0.2243 |
|
PTE |
0.4081 |
0.3050 |
0.3350 |
0.3291 |
0.2244 |
|
|
SE |
0.9718 |
0.9650 |
0.9361 |
0.8547 |
0.9995 |
|
|
SL |
0.9120 |
0.8660 |
0.8750 |
0.7850 |
1.0010 |
|
|
RTS |
+ |
+ |
+ |
+ |
- |
|
|
21 |
TE |
1 |
1 |
1 |
1 |
0.9281 |
|
PTE |
1 |
1 |
1 |
1 |
1 |
|
|
SE |
1 |
1 |
1 |
1 |
0.9281 |
|
|
SL |
1 |
1 |
1 |
1 |
1.3300 |
|
|
RTS |
—— |
—— |
—— |
—— |
- |
|
|
22 |
TE |
0.0346 |
0.1862 |
0.1009 |
0.1307 |
0.1771 |
|
PTE |
0.0839 |
0.1937 |
0.1142 |
0.1378 |
0.1790 |
|
|
SE |
0.4123 |
0.9612 |
0.8835 |
0.9484 |
0.9893 |
|
|
SL |
0.3760 |
0.6550 |
0.7300 |
0.6210 |
0.9070 |
|
|
RTS |
+ |
+ |
+ |
+ |
+ |
|
|
23 |
TE |
0.6982 |
0.3703 |
0.2932 |
1 |
0.7909 |
|
PTE |
0.7187 |
0.5038 |
0.3336 |
1 |
0.7952 |
|
|
SE |
0.9714 |
0.7350 |
0.8788 |
1 |
0.9945 |
|
|
SL |
0.8990 |
0.6020 |
0.7640 |
1 |
1.5590 |
|
|
RTS |
+ |
+ |
+ |
—— |
- |
|
|
24 |
TE |
0.6727 |
0.3727 |
0.3446 |
0.4479 |
0.4087 |
|
PTE |
0.6829 |
0.3733 |
0.3569 |
0.5049 |
0.5330 |
|
|
SE |
0.9850 |
0.9983 |
0.9655 |
0.8871 |
0.7667 |
|
|
SL |
0.8660 |
0.9240 |
1.0490 |
1.1750 |
1.1590 |
|
|
RTS |
+ |
+ |
- |
- |
- |
|
|
25 |
TE |
0.3843 |
0.2999 |
0.2929 |
0.3601 |
0.3481 |
|
PTE |
0.5620 |
0.3095 |
0.3051 |
0.3948 |
0.4112 |
|
|
SE |
0.6838 |
0.9689 |
0.9600 |
0.9121 |
0.8465 |
|
|
SL |
1.0810 |
0.9200 |
0.8980 |
1.2430 |
1.1590 |
|
|
RTS |
- |
+ |
+ |
- |
- |
|
|
26 |
TE |
1 |
0.4856 |
0.4362 |
0.5683 |
0.4264 |
|
PTE |
1 |
0.4966 |
0.4510 |
1 |
1 |
|
|
SE |
1 |
0.9778 |
0.9671 |
0.5683 |
0.4264 |
|
|
SL |
1 |
0.9610 |
0.9390 |
1.3810 |
1.3260 |
|
|
RTS |
—— |
+ |
+ |
- |
- |
|
|
27 |
TE |
1 |
1 |
1 |
1 |
0.9518 |
|
PTE |
1 |
1 |
1 |
1 |
1 |
|
|
SE |
1 |
1 |
1 |
1 |
0.9518 |
|
|
SL |
1 |
1 |
1 |
1 |
1.3910 |
|
|
RTS |
—— |
—— |
—— |
—— |
- |
|
|
28 |
TE |
0.7235 |
0.6043 |
0.8657 |
0.5969 |
0.5072 |
|
PTE |
0.9917 |
1 |
1 |
0.6663 |
0.5074 |
|
|
SE |
0.7295 |
0.6043 |
0.8657 |
0.8958 |
0.9996 |
|
|
SL |
0.6450 |
0.5560 |
1.4920 |
1.3020 |
0.9110 |
|
|
RTS |
+ |
+ |
- |
- |
+ |
|
|
29 |
TE |
0.7983 |
0.6882 |
0.7496 |
0.6153 |
1 |
|
PTE |
0.8702 |
0.6912 |
0.7561 |
0.7521 |
1 |
|
|
SE |
0.9173 |
0.9956 |
0.9914 |
0.8181 |
1 |
|
|
SL |
0.8640 |
0.9780 |
1.0710 |
0.7040 |
1 |
|
|
RTS |
+ |
+ |
- |
+ |
—— |
|
|
30 |
TE |
1 |
0.7569 |
0.7994 |
1 |
1 |
|
PTE |
1 |
0.8553 |
0.8297 |
1 |
1 |
|
|
SE |
1 |
0.8849 |
0.9634 |
1 |
1 |
|
|
SL |
1 |
0.8470 |
0.9330 |
1 |
1 |
|
|
RTS |
—— |
+ |
+ |
—— |
—— |
Where TE=Technical efficiency; PTE=Pure technical efficiency; SE=Scale Efficiency; SL=Sum lambda; RTS= Return to Scale
In this paper, the projection results of the sampled military and civilianenterprises of Jiangsu, Zhejiang, and Shanghai are analyzed in 2016. As shown in Table 6, except for the two sample enterprises with serial numbers 29 and 30, where there was no inefficiency in the input indicators, the other military and civilian enterprises in Jiangsu, Zhejiang, and Shanghai had different rates of inefficiency in terms of input targets. About 78.57% of the sampled enterprises have to cut their input index by more than 50% because of the size of the inefficiency. Among them, sample enterprise (6) had serious inefficiencies (94.98%) in the input indicators, and its total assets had the most serious inefficiency (93.57%), the main business costs accounted for 93.52% inefficiency. In addition, except for the two sample enterprises numbered 29 and 30, the average value of the improvement of assets and liabilities ratio, the average improvement range of main business cost and the improvement range of total assets was -58.56%, -65.81% and -61.43% respectively. We noticed that the sample enterprises with inefficient inputs generally had the highest degree of inefficiency in the indicators of main business cost inputs, followed by total assets. In terms of output, about 93.33% of sample enterprises did not reduce their output growth rate of main business. About 86.67% of sample enterprises (26) did not have any range for improvement in net asset turnover rate, and 53.33% of enterprises (16) did not also have any range for improvement in total asset turnover. In reference to the scale income of enterprises in Table 5, about 50% of sample enterprises in Jiangsu, Zhejiang, and Shanghai military and civilian integration enterprises in 2016 have made inefficient investments. 50% of sample enterprises are in decreasing returns to scale position. Among the sample enterprises with slack output, 60% of sample enterprises are in increasing returns to scale, while only 40% of sample enterprises are in decreasing returns to scale. Therefore, in the improvement policy, 50% of the sample enterprises are seen to have a comparative input inefficiency, while the output reduction of most sample enterprises is relative. In summary, most of the integration of listed enterprises in Jiangsu, Zhejiang, and Shanghai share unreasonable allocation of input resources, thus, there is some room for improvement in output values. The enterprises have, therefore, failed to achieve the effective distribution of resources and low financing efficiency.Thespecific results are in Table 6.
|
Serial number |
Input indicators |
Output indicators |
||||||||||
|
Assets and liabilities |
Main business costs (yuan) |
Total assets (yuan) |
Main business growth rate |
Total asset turnover |
Net asset profit |
|||||||
|
Target value |
Improvement rate |
Target value |
Improvement rate |
Target value |
Improvement rate |
Target value |
Improvement rate |
Target value |
Improvement rate |
Target value |
Improvement rate |
|
|
1 |
0.108 |
-75.45% |
258262400.1 |
-75.52% |
1461858576 |
-78.89% |
0.627 |
0.00% |
0.361 |
64.09% |
0.615 |
0.00% |
|
2 |
0.11 |
-82.26% |
194027803.6 |
-88.19% |
957902283 |
-82.18% |
0.516 |
0.00% |
0.411 |
11.08% |
0.615 |
0.00% |
|
3 |
0.109 |
-66.97% |
634991755.2 |
-79.71% |
1724564462 |
-67.09% |
0.472 |
0.00% |
0.73 |
0.00% |
0.692 |
0.00% |
|
4 |
0.158 |
-49.03% |
274770003.2 |
-66.80% |
1246045730 |
-49.05% |
0.553 |
0.00% |
0.59 |
0.00% |
0.949 |
0.00% |
|
5 |
0.073 |
-90.39% |
571672862.4 |
-93.71% |
2097964035 |
-91.58% |
0.416 |
0.00% |
0.49 |
0.00% |
0.615 |
0.00% |
|
6 |
0.054 |
-93.57% |
59579093.57 |
-93.52% |
854071882.7 |
-94.98% |
0.217 |
0.00% |
0.216 |
116.00% |
0.507 |
63.59% |
|
7 |
0.201 |
-45.68% |
188787159.7 |
-45.65% |
1058481622 |
-45.65% |
0.708 |
0.00% |
0.577 |
80.30% |
0.759 |
9.13% |
|
8 |
0.118 |
-75.92% |
600838424.1 |
-75.93% |
1135024666 |
-75.93% |
0.46 |
0.00% |
0.67 |
0.00% |
0.615 |
0.00% |
|
9 |
0.17 |
-73.85% |
168448476 |
-75.23% |
666941923.8 |
-73.78% |
0.491 |
0.00% |
0.47 |
17.50% |
0.718 |
0.00% |
|
10 |
0.106 |
-57.60% |
418177800.3 |
-65.70% |
2070680082 |
-57.58% |
0.646 |
0.00% |
0.47 |
0.00% |
0.795 |
0.00% |
|
11 |
0.121 |
-82.46% |
567690101.4 |
-87.09% |
3589366473 |
-82.45% |
0.907 |
0.00% |
0.461 |
70.74% |
0.744 |
0.00% |
|
12 |
0.057 |
-5.00% |
244884178.4 |
-5.09% |
1101051370 |
-70.50% |
0.24 |
240.00% |
0.376 |
121.18% |
0.667 |
0.00% |
|
13 |
0.233 |
-52.45% |
130620371.7 |
-52.42% |
1779425725 |
-52.42% |
0.665 |
0.00% |
0.461 |
207.33% |
0.969 |
38.30% |
|
14 |
0.261 |
-51.67% |
372930889.3 |
-64.29% |
978477372 |
-51.74% |
0.758 |
0.00% |
0.87 |
0.00% |
0.923 |
0.00% |
|
15 |
0.261 |
-15.81% |
152358925.6 |
-15.73% |
644774200.7 |
-15.73% |
0.621 |
0.00% |
0.622 |
9.12% |
0.872 |
0.00% |
|
16 |
0.107 |
-60.37% |
178389261.9 |
-63.04% |
933086878.1 |
-60.30% |
0.472 |
0.00% |
0.421 |
27.58% |
0.641 |
0.00% |
|
17 |
0.071 |
-82.68% |
476716423.5 |
-87.36% |
1411547999 |
-87.47% |
0.283 |
30.12% |
0.563 |
40.75% |
0.846 |
0.00% |
|
18 |
0.075 |
-80.26% |
33403022.17 |
-80.32% |
226893905.6 |
-80.32% |
0.186 |
0.00% |
0.15 |
0.00% |
0.178 |
178.00% |
|
19 |
0.104 |
-75.24% |
332464748.4 |
-76.63% |
1952898674 |
-75.35% |
0.683 |
0.00% |
0.363 |
25.17% |
0.641 |
0.00% |
|
20 |
0.13 |
-77.59% |
353058021 |
-82.21% |
1286735442 |
-77.57% |
0.602 |
0.00% |
0.56 |
0.00% |
0.795 |
0.00% |
|
21 |
0.195 |
-7.14% |
273407744.3 |
-30.99% |
1272714091 |
-7.19% |
0.739 |
0.00% |
0.669 |
19.46% |
1 |
0.00% |
|
22 |
0.097 |
-82.36% |
518453230.5 |
-88.32% |
2444028973 |
-82.29% |
0.677 |
0.00% |
0.44 |
0.00% |
0.667 |
0.00% |
|
23 |
0.095 |
-20.83% |
418710695.5 |
-52.30% |
3021211305 |
-24.16% |
0.652 |
0.00% |
0.407 |
27.19% |
0.692 |
0.00% |
|
24 |
0.135 |
-59.09% |
822652533.1 |
-75.85% |
1650022774 |
-59.13% |
0.46 |
0.00% |
1 |
0.00% |
0.692 |
0.00% |
|
25 |
0.15 |
-65.12% |
862144827.1 |
-69.47% |
1382818753 |
-65.19% |
0.522 |
0.00% |
0.94 |
0.00% |
0.744 |
0.00% |
|
26 |
0.162 |
-57.37% |
893004353.9 |
-61.61% |
1466270443 |
-57.36% |
0.54 |
0.00% |
0.99 |
0.00% |
0.923 |
0.00% |
|
27 |
0.086 |
-4.44% |
297833529.3 |
-37.25% |
1686528032 |
-4.82% |
0.398 |
0.00% |
0.5 |
0.00% |
0.949 |
0.00% |
|
28 |
0.122 |
-49.17% |
623052756.1 |
-52.76% |
1927471256 |
-49.28% |
0.671 |
0.00% |
0.58 |
0.00% |
0.718 |
0.00% |
|
29 |
0.13 |
0.00% |
734014751.9 |
0.00% |
982006554.7 |
0.00% |
0.429 |
0.00% |
0.78 |
0.00% |
0.615 |
0.00% |
|
30 |
0.13 |
0.00% |
559783957 |
0.00% |
3006197698 |
0.00% |
1 |
0.00% |
0.44 |
0.00% |
0.744 |
0.00% |
Table 7: Technical efficiency scores of military and civil integration enterprises in Jiangsu, Zhejiang, and Shanghai
|
Enterprise serial number |
Efficiency scores |
Total average |
Percentage |
||||
|
2012 |
2013 |
2014 |
2015 |
2016 |
|||
|
1 |
0.138 |
0.1124 |
0.0771 |
0.07 |
0.2448 |
0.1285 |
0.92 |
|
2 |
0.3873 |
0.2183 |
0.1979 |
0.3308 |
0.1782 |
0.2625 |
1.88 |
|
3 |
0.3588 |
1 |
0.3241 |
0.3478 |
0.3291 |
0.4720 |
3.38 |
|
4 |
0.4486 |
0.8335 |
0.4674 |
0.5156 |
0.5095 |
0.5549 |
3.97 |
|
5 |
0.1886 |
0.0839 |
0.0841 |
0.1504 |
0.0963 |
0.1207 |
0.86 |
|
6 |
0.2184 |
0.1162 |
0.1011 |
0.0901 |
0.0648 |
0.1181 |
0.84 |
|
7 |
0.6741 |
0.395 |
0.3588 |
0.2578 |
0.5435 |
0.4458 |
3.19 |
|
8 |
0.2948 |
0.2164 |
0.3026 |
0.1838 |
0.2407 |
0.2477 |
1.77 |
|
9 |
0.2847 |
0.2569 |
0.2351 |
0.2413 |
0.2622 |
0.2560 |
1.83 |
|
10 |
0.5388 |
0.4834 |
0.4101 |
0.3309 |
0.4242 |
0.4375 |
3.13 |
|
11 |
0.0792 |
0.0471 |
0.0396 |
0.0547 |
0.1755 |
0.0792 |
0.57 |
|
12 |
0.6466 |
0.5655 |
0.7597 |
1 |
0.9491 |
0.7842 |
5.61 |
|
13 |
1 |
0.3016 |
0.1672 |
0.233 |
0.4758 |
0.4355 |
3.11 |
|
14 |
0.6774 |
0.4529 |
0.4685 |
0.5869 |
0.4826 |
0.5337 |
3.82 |
|
15 |
1 |
0.9225 |
0.9223 |
1 |
0.8427 |
0.9375 |
6.70 |
|
16 |
0.5788 |
0.2647 |
0.4017 |
0.5872 |
0.3969 |
0.4459 |
3.19 |
|
17 |
0.2251 |
0.166 |
0.1594 |
0.1474 |
0.1743 |
0.1744 |
1.25 |
|
18 |
0.9164 |
0.5937 |
0.7025 |
0.3259 |
0.1968 |
0.5471 |
3.91 |
|
19 |
0.48 |
0.1775 |
0.0985 |
0.2797 |
0.2465 |
0.2564 |
1.83 |
|
20 |
0.3966 |
0.304 |
0.3036 |
0.2813 |
0.2243 |
0.3020 |
2.16 |
|
21 |
1 |
1 |
1 |
1 |
0.9281 |
0.9856 |
7.05 |
|
22 |
0.0346 |
0.1862 |
0.1009 |
0.1307 |
0.1771 |
0.1259 |
0.90 |
|
23 |
0.6982 |
0.3703 |
0.2932 |
1 |
0.7909 |
0.6305 |
4.51 |
|
24 |
0.6727 |
0.3727 |
0.3446 |
0.4479 |
0.4087 |
0.4493 |
3.21 |
|
25 |
0.3843 |
0.2999 |
0.2929 |
0.3601 |
0.3481 |
0.3371 |
2.41 |
|
26 |
1 |
0.4856 |
0.4362 |
0.5683 |
0.4264 |
0.5833 |
4.17 |
|
27 |
1 |
1 |
1 |
1 |
0.9518 |
0.9904 |
7.08 |
|
28 |
0.7235 |
0.6043 |
0.8657 |
0.5969 |
0.5072 |
0.6595 |
4.72 |
|
29 |
0.7983 |
0.6882 |
0.7496 |
0.6153 |
1 |
0.7703 |
5.51 |
|
30 |
1 |
0.7569 |
0.7994 |
1 |
1 |
0.9113 |
6.52 |
|
Total average |
0.5615 |
0.4425 |
0.4155 |
0.4578 |
0.4532 |
0.4660 |
|
In this section, the input-oriented efficiency scores attained from the CCR and BCC models have been discussed. This paper tries to measure the financing efficiency of the listed enterprises of military and civilian integration in Jiangsu, Zhejiang and Shanghai and also to explore the areas that will bring an improvement or financing efficiency (stability) to these establishments.It is noteworthy to note that input-oriented efficiency measures address the question: ‘what amount of input quantities can be proportionately reduced without changing the output quantities produced?’ Table 5 presents financial efficiency scores of the 30 military and civilian integration enterprises along with the extent of their scale incomes. The results indicate that the listed enterprises of military and civilian integration in Jiangsu, Zhejiang and Shanghai has been characterized with immense asymmetry between enterprises as regards to overall technical efficiency (in percentages) that ranges between 7.92% (0.0792) and 99.04% (0.9904). The average of technical efficiency scores of the 30 military and civilian integration enterprises for the study period turned out to be 0.466 (see Table 2). This indicates that an average military and civilian integration enterprise, if producing its outputs on the efficient frontier instead of its virtual location, would only need 46.6% of the inputs currently being employed. This shows that, by implementing best financial practices, military and civilian integration enterprise can, on an average, decrease their inputs of asset-liability ratio, main business cost and total assets by at least 53.4% and still produce at the same level of outputs. Nevertheless, the possible decrease in inputs from implementing best financial practices varies from enterprise to enterprise. On the other hand, military and civilian integration enterprises have the prospect producing 2.15 times (1/0.466) as much as output from the same level of inputs employed.As earlier indicated that an enterprise with technical efficiency score equal to 1 is deemed to be efficient and the enterprises with technical efficiency score less than 1 is considered to be relatively inefficient. Results from the 30 military and civilian integration enterprises, only a few enterprises (10) were seen to be efficient for various years (see Table 5). However, results from their total averages indicates that all the enterprises were not technically efficient since none of them attained an efficiency score of 1 (see Table 7).The resource utilization process in these enterprises is not effective, meaning that the production process of these enterprises is characterized by a lot of waste of inputs. The results, thus, suggests a presence of serious deviations of the military and civilian integration enterprises from the best financial practices. These enterprises can improve their efficiency by decreasing their inputs. Overall technical efficiency scores (0.0792 to 0.9904) among the enterprises can potentially decrease their current inputs levels by 92.08% and 9.6%, respectively while leaving their output levels unaffected. Turning to the analysis of pure technical efficiency and scale efficiency measures for the military and civilian integration enterprises as a whole, it is detected that the technical inefficiency in these enterprises is due to both poor input application (i.e., pure technical inefficiency) and failure to operate at most productive scale size (i.e., scale inefficiency). The average PTE score for the 30 military and civilian integration enterprises has been observed to be 0.5279 (see Table 2). This implies that 47.2% out of the about 53.4% of the technical inefficiency is as a result of inappropriate management practices and choosing incorrect input combinations. The rest of the technical inefficiency appears due to inappropriate scale of military and civilian integration enterprises operations. The results from Table 5 indicate that some enterprises in certain years (13%) are operating at most productive scale size and experiencing Constant Return to Scale (CRS). Additionally, in 63% of the years of the enterprises are operating below their optimal scale size and thus, experiencing Increasing Return to Scale (IRS). The policy implication of this finding is that these military and civilian integration enterprises can improve their technical efficiency by increasing their size. The remaining 24% of the enterprises in certain years have been seen to be operating in the region of Decreasing Return to Scale (DRS) and, therefore, downscaling seems to be an appropriate strategic option for these enterprises in their pursuit to decrease unit costs. On the whole, IRS is observed to be the main form of scale inefficiency in military and civilian integration enterprises in Jiangsu, Zhejiang, and Shanghai for the study period. Table 6 also presents the target values of inputs and outputs for inefficient military and civilian integration enterprises along with possible increase in outputs and possible decrease in inputs. The possible improvement shows those areas of improvement in input-output activity needed to put an inefficient enterprise onto the efficient frontier. For getting what these figures of potential input decrease and output increase show, consider the case of enterprise 11, the most inefficient enterprise in terms of average in the sample. To move onto the efficient frontier, enterprise 11 needs to reduce its asset-liability inputs by 82.5%, decrease business cost by 87.1 percent and augment total asset turnover by 71%. We can, therefore, also draw similar conclusions for other inefficient enterprises.Considering financing efficiency of listed enterprises of military and civilian integration enterprises in Jiangsu, Zhejiang, and Shanghai as a whole, they need to reduce, on an average, assets liability, main business cost, and total assets by 55%, 61%, and 57%, respectively and increase the main business growth rate, total asset turnover and net asset profit by 9%, 28% and 9.6%, respectively if they wish to project all the inefficient military and civilian integration enterprises onto the efficient frontier.
This paper evaluates the financing efficiency of listed enterprises of military and civilianintegration in Jiangsu, Zhejiang, and Shanghaifrom 2012 to 2016 using data envelopment analysis (DEA) model. The paper further on analyzed the data from 30 sampled military and civilianintegrated enterprises by looking at the overall technical efficiency, scale income, and the projections analysis. The results showed that for the whole research period (2012 – 2016) the overall technical efficiency was relatively low. The scale income values of most of the enterprises were seen to be higher than its pure technical efficiency, thus, the pure technical efficiency was the main cause for the low technical efficient values. According to the results, those enterprises that were in a state of decreasing returns to scale showed a clear trend of growth, thus, as the years went by the values of those enterprises kept on increasing. However, those enterprises that were in a state of increasing returns to scale were seen to be decreasing, thus, as the years went by the values of those enterprises were decreasing. In 2016, nearly half of the sample enterprises were in a state of decreasing returns to scale with serious investment inefficiency. It is suggested that, firstly, the enterprises should identify the main factors that affect the efficiency of their financing, adjust the size of input-output to augment the structure of resource allocation and take noteof the collection of favorable resources in all aspects to improve their financing efficiency. Secondly, enterprises can also improve the financing efficiency of their enterprises by implementing the patent and standard synergy mechanism and mode (Mingxing, 2009). Thirdly, the sample enterprises should continually increase investment in innovation and adapt to relevant national industrial restructuring and opening-up policies and actively support innovation (Yuanbo & Yanyu, 2017). In addition, enterprises should appropriately reduce the asset-liability ratio, reduce liability financing and increase equity financing to achieve diversified financing, thereby optimizing the capital structure of enterprises and raising the financing efficiency of enterprises. Finally, the Chinese government should vigorously promote the construction of venture capital funds and promote the reform of the banking system by establishing specialized science and technology banks. Thegovernment should also actively support the innovation of corporate finance, improve the network system of financing and broaden the channels for the integration of the military and civilian enterprises.
This research was supported by Social Science Funding Project of Jiangsu Province (No. 18GLB024).
Charnes, A., Cooper, W. W., & Rhodes, E. (1978). Measuring the efficiency of decision making units. European journal of operational research, 2(6), 429-444.
Coelli, T. J., Rao, D. S. P., O'Donnell, C. J., & Battese, G. E. (2005). An introduction to efficiency and productivity analysis: Springer Science & Business Media.
Cooper, W. W., Seiford, L. M., & Zhu, J. (2004). Handbook on Data Envelopment Analysis. U.S.A.: Springer US.
Huang Xichuan, & Tianyi, Z. (2017). Evaluation of Innovation Capability of High-tech Industrial Cluster Integrated with Military and Civilian - An Empirical Study on Five Industrial Cluster of Military and Civilian Integration in Jiangsu Technology Progress and Countermeasures, 34(14), 147-153.
Koltai, T., & Uzonyi-Kecskés, J. (2017). The Comparison of Data Envelopment Analysis (DEA) and Financial Analysis Results in a Production Simulation Game. Acta Polytechnica Hungarica, 14(4), 167-185.
Lin, L. (2017). China's Answer to the US Military-Industrial Complex. The Diplomat.
Liu Min, & Haojie, Z. (2016). Comparative analysis of management efficiency of listed military industrial enterprises under the perspective of military and civilian integration Jiangxi Social Sciences(2), 188-193.
Long, T. J. (2017). Asymmetry of military and civilian integration and governance measures China Science and Technology Forum(4), 111-117.
Mingxing, L. (2009). Market-Oriented Synergetic Development of Patents and Standards. Science of Science and Management, 30(10), 43-47.
Rabar, D. (2017). An overview of data envelopment analysis application in studies on the socio-economic performance of OECD countries. Economic research-Ekonomska istraživanja, 30(1), 1770-1784.
Shangfen, G. (2014). Study on constructing coordinated innovation mechanism for military and civilian integration. Science & Technology Progress and Policy, 95-97.
Tan, L. (2016). Research on Collaborative Management Structure of Intellectual Property in Military and Civil Integration Enterprises. Science & Technology Progress and Policy, 33(12), 119 - 124.
Tao, S. (2015). Research on Mechanism of Technological Accumulation, Capacity Structure and Sustainable Growth of Military and Commercial Integration Enterprises - An Analysis Based on Technology Transfer Science & Technology Progress and Policy(18), 109-113.
Tone, K., & Tsutsui, M. (2017). The Dynamic DEA Model. Advances in DEA Theory and Application, 64-73. doi:10.1002/9781118946688.ch8
Wang Bai-jie, & Ai-wen, L. (2016). Estimation of the Efficiency of Military and Commercial Integration Enterprises and Its Influencing Factors - Evidence from Listed Companies of "Top Ten Military Groups" in China Science and Technology Management Research, 36(23), 67 - 73.
Xinyu, W. (2001). Evaluation of business efficiency of urban department store retailers based on the DEA model Systems Engineering, 19(1), 56-60.
Xiu-Zhen, W., Hui-Ping, D., & Yi, H. (2017). Evaluation of financing efficiency of Chinese small and medium-sized enterprises based on DEA Systems Engineering Theory and Practice, 37(4), 865-874.
Yuan, F. (2016). Game and Governance of Information Sharing in Civil-military Integration Innovation. Information Studies: Theory & Application, 8, 017.
Yuanbo, Q., & Yanyu, W. (2017). Evaluation of China's provincial innovation efficiency based on three-stage DEA-Windows analysis Science and Technology Management Research, 38(1), 88-97.
Zhao, L.-m., Sun, J.-h., & Zhang, H.-b. (2017). Technology sharing behavior in civil-military integration collaborative innovation system based on differential game. Journal of Industrial Engineering and Engineering Management, 3, 023.

