|
Shafique Ahmed Department of Business Administration Sindh Maddressatul Islam University Karachi, Pakistan shafique@smiu.edu.pk |
Farhan Ahmed Department of Economics and Management Sciences NED University of Engineering & Technology Karachi, Pakistan farhan_mba21@live.com |
Muhammad Kashif Department of Business Administration Shaheed Zulfikar Ali Bhutto Institute of Science and Technology Karachi, Pakistan muhammad.kashif@szabist.edu.pk |
Muzafar Ali Shah Department of Business Administration Sindh Maddressatul Islam University Karachi, Pakistan |
This study attempted to understand the key price determinants of residential properties in Karachi by using the hedonic approach. Structural attributes, Locational attributes, and environmental attributes are the key determinants for valuation of residential properties and that is why investors considered the role of these factors as significant in developing any residential project. The residents have also shown a great deal of concern for these factors and they will be willing to pay if these factors are being considered while developing any residential project. Mostly hedonic models are estimated using regression techniques and in order to estimate the significance level of the Structural attributes, Locational attributes, and environmental attributes, this paper has used regression techniques through which coefficients of various dimensions of above-mentioned attributes are measured. For that sample of 500 residential properties that are available for sale forthe last three months, in2019 were obtained.This study found that among structural attributes, new houses, covered area, and the number of bedrooms has a significant impact on housing prices. The coefficient value of these structural attributesis -.107, .722 & .094 with the p-value less than 0.05 respectively. However, among the locational attributes, the number of school and proximity were negatively significant. In addition to environmental attributes that included proximity to industrial area and number of parks were also significant. This is the first systematic study of residential properties in Karachi by using hedonic model and study suggested various alternatives to the builders, investors, and buyers of the residential properties in Karachi.
KEYWORDS:House,prices, Hedonic pricing model, Real Estate
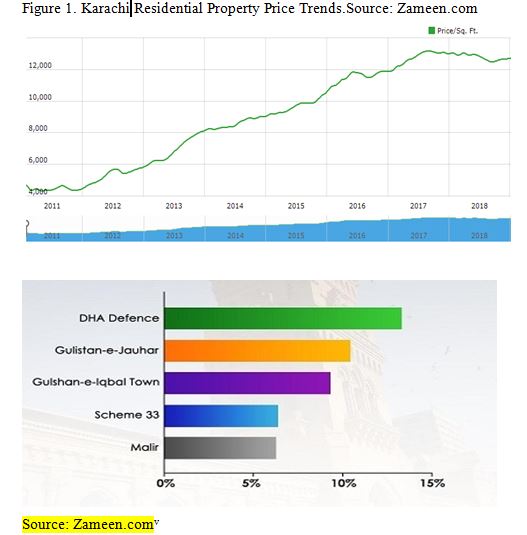
The shelter is one of the basic need of human being since the inception and everyone strives to have a safe and secure house in order to spend a comfortable happy life. In this modern era as increasing population leads to increasing demand for the houses and more specifically metropolitan cities are the most desirable place where most of the portion of the population want to live.The metropolitan cities remain a great place of attraction for living purpose and it can be witnessed by observing the prices in these cities. Around the world, cities of the Asian continent remains most expensive closely followed by European cities. Karachi is one of the largest metropolitan city of Pakistan and the capital of Sindh province. This city is located on the Arabian Sea and popular with other names like “City of Lights”. Its importance is not only due to the capital city of Sindh Province, but it remained as the highest source of the revenue-generating city for Pakistansince inception and that is why it is named as the financial hub of Pakistan. Three major cities; Karachi 55%, Islamabad 16%, and Lahore 15%, of Pakistan generates 86% of the revenue and out of 86% Karachi contributes more than 60%. There is a drastic increase in the urban population and there is hardly any difference between the ratio of the rural and urban population. This city is one of the most preferred city for most of the proportion of population due to the highest potential of economic activities, comparatively better health and education facility and consequently better life standard.However, migration from rural areas results in slums and shantytowns in the city because of the absence of formal planning and structure for the urban population and migrants. But on the other side,the presence of business and employment opportunities in the city creates a lot of demand for housing in the city and that is why lots of projects are ongoing in different areas of Karachi. Like Pakistan,the real estate market is the most preferred market for the investment purpose and its significance can be witnessed by growing demand for houses in Pakistan. Association of Builders and Developers (ABAD) has reported that currently, Pakistan is facing housing deficit of 800,000 units and shortfall will increase by 300,000 units each year . More importantly, this sector of Pakistan has been successful in seeking foreign investments and it can be witnessed by improved ranking position in the Real Estate Transparency Index. According to Real Estate, Transparency Index report of 2018 Pakistan has improved its position and ranked at 75th as compared to 90th position earlier in 2016 (Farooq, 2018). Karachi has a lot of significant attraction by people from all across the country just because of its potential in providing a job or business opportunity.Figure 1 is portraying the prices of residential properties, which are continuously increasing since 2011. These incremental trends attract more investment in this sector. However, this increasing trend is being observed due to continues development in Karachi and more importantly restoration of peace. That it is why even buyer is willing to pay the incremental price because of some satisfactory factors like structure, location, and surrounded environment. The highest increasing trend is prevailing in DHA area where the price of residential property is 16,645 sq.ft. and more interestingly the figure 2 shows the most preferred areas to buy houses in Karachi in Jan 2019 were DHA then followed by Gulistan-e-Jauhar, Gulshan-e-Iqbal Town, Scheme 33 and Malir. This gives some evidence regarding buyers’ willingness to pay the incremental price in order to avail a satisfactory residential unit.
The major reason behind the highest transaction of buying and selling in DHA can be that the real estate in DHA Defence, Karachi, is not only meticulously planned, but it also has a regulated administration. In March 1953, a housing society was established by a group of retired Army officers, named Defence Officers Housing Society, Karachi. Later, in the year 1981, under presidential orders, it was taken over by the government, who then gave the controls to the Corps Commander, Karachi. A municipal cover is provided by Clifton Cantonment Board (CBC), which is an autonomous civic body. CBC encompasses the eight phases of Defence Housing Authority, katchiabaadis and Clifton Blocks 8 and 9. Its functions are maintaining public parks, streets, potting plants on roadsides, providing a sufficient supply of water, implementing good sanitation practices, conducting a census and also ensuring public safety. Further with respect to the planning and development, Defence Housing Authority, Karachi covers 8,838 acres of land. It is one of the most urbanized and prestigious housing societies of the city. The frontline of DHA displays Karachi’s beautiful beach. It consists of eight phases, offering unmatched, high-quality standards of living. With such great potential in this sector, this study is looking to study the most preferred factors in determining the price of houses in Pakistan. In most of the countries hedonic pricing model used in order to estimate the housing prices. So this study is looking to analyze the prices of residential properties inKarachi by using the hedonic housing pricing model.
This study will be looking for factors in estimating the prices of houses/apartments. This study will also be aiming to determine the relative preference of factors to be considered while estimating the prices.
1)	To investigate the impact of structural attributes on houses prices.
2)	To investigate the impact of location attributes on houses prices.
3)	To investigate the impact of environmental attributes on houses prices
Housing property is considered as structure along with various facility which can be useful for the residents. So it is a kind of structure that is available for persons for occupation in order to spend their lives (Case & Shiller, 2003). There are multidimensional factors connected with residential property, these factors contribute a significant role in ascertaining the house prices (Ge & Du, 2007). These factors classified into two broad categories which are internal and external factors. These factors have either positive or negative effects on property values (Bello & Bello, 2007). The valuation of property is depending on some set of attributes related to the target property (Choy et al., 2007). Rosen (1974) presented the theoretical contribution of the hedonic price theory and argued that a single good has various attributes, and each character has a value contributing to the price of the item in an equilibrium market Various studies have identified structural attributes as one of the internal factor as price determinants of residential property (Li et al., 2018; Gizem et al., 2018; Shaban et al., 2015; Chiang et al., 2015; Oloke et al., 2013; Chernobai et al., 2008; Iman et al., 2009). These studies have described the age of the building, age of the house, covered area, bedrooms, bathrooms, garage, lawn, direction, decoration, and parking facilities as the key determinant of structural attributes. Spatial characteristics are related to the location attributes of the property. Studies suggested that proximity to city centers, schools, hospitals, and transports played a significant role in price determination of residential properties (Khan et al., 2017). Gizem et al., (2018) revealed the significance of locational attributes while estimating the valuation of houses through hedonic pricing model in Ankara, Turkey. Tse& love (2000) in Hong Kong concluded that residential properties exhibit a negative price-distance relationship with shopping centers. Various studies have investigated the impact of locational attributes and found negative impact and there is one reason behind this is environment variables that include noise and air pollution. Kim & Johnson (2000) studied the environment variables and revealed the significance of these factors in price determination. The environmental factors play a significant role in enhancing the willingness of buyers to pay higher prices for target property (Kim & Johnson, 2002).
The past studies suggested that the property value is function some attributes associated with property and various studies have identified structural attributes, locational attributes and environmental attributes as the factors that play significant role in price determination of residential properties (Hussain et al., 2019; Li et al., 2018; Gizem et al., 2018; Shabana et al., 2015). The Hedonic valuation method has been adopted from previous studies. A lot of studies have taken the hedonic pricing model in order to evaluate residential properties. Initially, the concept was explored by Court (1939) and then Lancaster (1966) studied with some modification based on the consumer behavior theory, which stated that the features of any commodity determine its price. The method became well known after study of Rosen (1974) and he stated that there are different attributes associated with the residential properties and those attributes are the basis for any price determination of that house. Therefore, different attributes have different significance in price determination. As per the literature review, three factors have a significant role in price determination as the buyers of the house are willing to pay an extra premium in order to take an additional level of utility. So the price for resident, who is enjoying the property that is near to shopping centers, will be different from that who has no locational benefit. The estimation of house prices can be explained through structural attributes, location attributes, and environmental attributes. The model equation is given below;
Pi = β0 + β1 SA + β2 LA + β3EA + ε
Whereas
P = Housing Prices
SA= Structural Attributes
LA= Location Attributes
EA= Environmental Attributes
Structural Attributes: The structural attributes mean age, covered area, Number of rooms, number of bathrooms and direction of the property.
Location Attributes: It refers to the proximity towards facilities likethe city center, hospitals, and education institutes.
Environmental Attributes: It refers to the cleanness of area, and proximity to Industrial Zone.
The study is cross-sectional and designed to explain the price determinants of residential property by using the hedonic pricing method. This explanatory study is based on cause and effects in order to seek the significant price determinants of residential property. A research paradigm is positivist philosophy because the study has the purpose to disclose the cause and effects of explanatory variables based on the empirical evidence. The study is focused on to empirically confirm the already explored variables which are influencing the willingness of buyers to pay the price for residential property.
In order to achieve the research objective, property data was collected from zameen.com which is the first largest and most reliable online platform for sales and purchase of the property. The data forthe last three months in 2019 was considered for the study. This is the web portal, where there are over five million monthly users and more than 12,500 agencies are registered. In addition to that on zameen.com portal, there are over 350,000 new listings each month. There are 35,598 residential properties that are available for sale out of which 16,557 are flats and 16,315 are houses. Further, in order to gauge the locational attributes that include the number of schools, proximity to hospitals and city centers, google map will be used. Some variables like direction, availability of sewerage, availability of parking gauged by using the dichotomous scale.
Based on the hedonic housing price model, price is the dependent variable and independent variables are structural attributes, location attributes, and environmental attributes (Shabana et al., 2015). Structural attributes are gauged by considering the age of the house, covered area, number of bedrooms, availability of parking facilities and direction of the apartments. These all items help in gauging the structural attributes of the property (Hussain et al., 2019; Lie at al., 2018; Yixiong et al., 2017; Abidoye& Chan, 2016). Location attribute is another variable of the study, it is related to the proximity of the property to the various amenities. The buyers consider the availability of schools, distance towards hospitals and city’s business center location and they all collectively explained the locational attributes (Dziauddin& Idris, 2018; Thaker&Sakaran, 2016; Huang & Yin, 2015; Saw & Tan, 2014; Tan, 2011; Ricardo et al., 2010; Daly et al., 2003). Environmental attributes related to the quality of environment surrounding the property, as the availability of parks, water quality, distance from airports, distance from railways station, distance from industrial zone and existence of sewerage system. These factors found very important for the buyer in order to stimulate their willingness to pay the price of residential property (Gizem et al., 2018; Xiao et al., 2017; Wen & Tao, 2015; Poudyal et al., 2009).
The concept of hedonic price model is based on that the price of the house will be determined by the attributes associated with the property. Therefore, these attributes can be considered as a function of house prices and can be written in the form of the equation mentioned below;
Pi = α+ βXi+ ε							(1)
Where P is the price of the house and X is a matrix of independent variables, β is the coefficient of independent variables that will help in explaining the magnitude of impact on dependent variable caused by independent variables. However, Ꜫ is the error term that represents the impact on the dependent variable caused by unknown factors.
If we further expand X, then X can be replaced by structural attributes (SA), Locational Attributes (LA) and Environmental attributes (EA). So the equation can be written as;
Pi= α+ β1 SAi+ β2 LAi+ β3 EAi+ ε				(2)
In order to estimate the structural, locational and environmental effect on the residential properties, the final form of the estimation that the study will be using is given below;
Pi= α+ β1 x1i+ β2 x2i+ β3 x3i + β4 x4i + β5 x5i + β6 x6i+ β7 x7i+ β8 x8i+ β9 x9i+ β10 x10i+ε								 (3)
Whereas;
Structural attributes’ (SA) Dimensions
x1 = Age of house
x2 = Covered area
x3 = Number of bed rooms
x4 = Number of bed rooms
x5 = Direction of the apartments (West & other)
Locational attributes’ (LA) Dimensions
x6 = Proximity to citycenter
x7= Number of schools
x8 = Proximity to hospitals
Environmental Attributes’ (LA) Dimensions
x9 = distance from industrial zone
x10 = Number of Parks
Structural attributes’ (SA) Dimensions H1: Age of house has no significant impact on the price of residential property. H2:The covered area has no significant impact on the price of residential property. H3: Number of bedrooms has no significant impact on the price of residential property. H4: Number of bathrooms has no significant impact on the price of residential property. H5: Direction of the apartments has no significant impact on the price of residential property. H6: Proximity to the city center has no significant impact on the price of residential property H7: Number of schools within the area has no significant impact on the price of residential property H8: Proximity to hospitals has no significant impact on the price of residential property Environmental Attributes’ (LA) Dimensions H9: Distance from the industrial zone has no significant impact on the price of residential property. H10: Number of parks has no significant impact on the price of residential property.
Based on convenient sampling, data for the study was taken from primary and secondary sources. Data was collected from zameen.com and then collected data was confirmed from the real estate agents in order to retain the validity and reliability of data. This study used cross-sectional data because data is for one point of time for the various region. The study is aiming to explain the impact of hedonic variables in price determination of residential properties in Karachi, however, due to the time limitation data was collected from ten regions of Defense Housing Authority, Karachi. The equal number of observations collected for each region and overall sample size for the study is 500. This can be witnessed from below mention table 1.
|
Table 1. Frequency of observations region wise |
|||||
|
Regions |
Frequency |
Percent |
Valid Percent |
Cumulative Percent |
|
|
Valid |
DHA Phase 1 |
51 |
10.2 |
10.2 |
10.2 |
|
DHA Phase 2 |
50 |
10.0 |
10.0 |
20.2 |
|
|
DHA Phase 2 Ext |
50 |
10.0 |
10.0 |
30.2 |
|
|
DHA Phase 3 |
50 |
10.0 |
10.0 |
40.2 |
|
|
DHA Phase 4 |
49 |
9.8 |
9.8 |
50.0 |
|
|
DHA Phase 5 |
50 |
10.0 |
10.0 |
60.0 |
|
|
DHA Phase 6 |
50 |
10.0 |
10.0 |
70.0 |
|
|
DHA Phase 7 |
50 |
10.0 |
10.0 |
80.0 |
|
|
DHA Phase 7 Ext |
50 |
10.0 |
10.0 |
90.0 |
|
|
DHA Phase 8 |
50 |
10.0 |
10.0 |
100.0 |
|
|
Total |
500 |
100.0 |
100.0 |
|
|
The DHA is the most expensive area in Karachi in order to check the description regarding residential property table 2. explains that the minimum residential house is worth ten million and the highest price is sixty million rupees. On average house prices are a hundred million. In structural attributes, minimum covered area is hundred square yards and the maximum area is two thousand square yards. On average the covered area is five hundred square yards. On an average number of rooms along with bathrooms are five. Proximity to the city center is 7.9 kilometers and the average distance from the industrial area is 8.2 kilometers.
|
|
|
|
||||||||||
|
|
N |
Min |
Max |
Mean |
Std. Deviation |
|||||||
|
Regions |
500 |
1 |
10 |
5.49 |
2.882 |
|||||||
|
Price of residential property |
500 |
10,000,000.0 |
600,000,000.0 |
100,800,600.000 |
68,379,912.2875 |
|||||||
|
Age of Property In Years |
500 |
.2 |
50.0 |
7.748 |
7.6572 |
|||||||
|
Covered area Sqyards |
500 |
100.0 |
2000.0 |
554.580 |
388.8589 |
|||||||
|
Number of Bed Rooms |
500 |
2.0 |
10.0 |
5.054 |
1.2370 |
|||||||
|
Number of Bath Rooms |
500 |
2.0 |
10.0 |
5.538 |
1.4016 |
|||||||
|
Direction West=1, Non-west=0 |
500 |
0.0 |
1.0 |
.156 |
.3632 |
|||||||
|
Proximity to city center Distance in Km |
500 |
5.7 |
12.5 |
7.915 |
2.0562 |
|||||||
|
No. of Schools within area |
500 |
1.0 |
17.0 |
5.502 |
5.0483 |
|||||||
|
Nearest Hospital in Km |
500 |
.11 |
4.10 |
1.8816 |
1.20527 |
|||||||
|
Availability of Commercial area (Yes=1, No=0) |
500 |
1.0 |
1.0 |
1.000 |
.0000 |
|||||||
|
Proximity to Industrial Area Distance in KM |
500 |
6.5 |
11.1 |
8.260 |
1.7288 |
|||||||
|
No. of parks with in area |
500 |
0.0 |
14.0 |
4.200 |
3.8196 |
|||||||
|
Valid N (listwise) |
500 |
|
|
|
|
|||||||
|
Table 3.Regions * DirectionWest1Nonwest0 Cross tabulation |
|
|||||||||||
|
|
|
|||||||||||
|
|
Direction (West=1, Non-west=0) |
Total |
|
|||||||||
|
Non-West |
West |
|
||||||||||
|
Regions |
DHA Phase 1 |
48 |
3 |
51 |
|
|||||||
|
DHA Phase 2 |
48 |
2 |
50 |
|
||||||||
|
DHA Phase 2 Ext |
35 |
15 |
50 |
|
||||||||
|
DHA Phase 3 |
50 |
0 |
50 |
|
||||||||
|
DHA Phase 4 |
47 |
2 |
49 |
|
||||||||
|
DHA Phase 5 |
40 |
10 |
50 |
|
||||||||
|
DHA Phase 6 |
34 |
16 |
50 |
|
||||||||
|
DHA Phase 7 |
34 |
16 |
50 |
|
||||||||
|
DHA Phase 7 Ext |
47 |
3 |
50 |
|
||||||||
|
DHA Phase 8 |
39 |
11 |
50 |
|
||||||||
|
Total |
422 |
78 |
500 |
|
||||||||
In order to run the regression, analysis normality is the prerequisite assumption. In order to meet the normality assumption, the square root of the houses prices was taken. Further, in order to remove the outlier effects, Mahalanobis distance was used. Mahalanobisdistance is the distance of a particular case from the centroid of the remaining cases, where the centroid is the point created by the means of all the variables (Tabachnick&Fidell, 2001). By using Mahalanobis distance, 65 outliers were found and removed from the data based on comparing the Mahalanobis distance against the critical value by using the chi-square critical value table with the number of independent variables as the degree of freedom value. As in table 4., it can be seen that Mahalanobis distance for the maximum value is 30.131 that is less than the critical value that is 31.264. Once the Mahalanobis distance value is less than the critical value it means the normality assumption holds (Tabachnick&Fidell, 2001). Further, normality assumption for the residuals, Kolmogorov-Smirnov normality test was used and as the p-value is .069 give in table 5., which means it failed to reject the null hypothesis and per Kolmogorov-Smirnov, the null hypothesis is that the data is normally distributed. Hence the null hypothesis was not rejected that means the data normality assumption holds.
|
Table 4. Residuals Statisticsa |
|||||
|
|
Minimum |
Maximum |
Mean |
Std. Deviation |
N |
|
Predicted Value |
5710.8950 |
15676.7881 |
9524.1098 |
2176.24394 |
435 |
|
Std. Predicted Value |
-1.752 |
2.827 |
.000 |
1.000 |
435 |
|
Standard Error of Predicted Value |
101.488 |
298.888 |
173.584 |
36.973 |
435 |
|
Adjusted Predicted Value |
5711.2070 |
15845.1328 |
9524.1200 |
2178.50929 |
435 |
|
Residual |
-2706.07471 |
5763.91797 |
.00000 |
1103.08415 |
435 |
|
Std. Residual |
-2.425 |
5.165 |
.000 |
.988 |
435 |
|
Stud. Residual |
-2.472 |
5.308 |
.000 |
1.004 |
435 |
|
Deleted Residual |
-2812.70361 |
6089.04346 |
-.01017 |
1138.07765 |
435 |
|
Stud. Deleted Residual |
-2.487 |
5.488 |
.001 |
1.009 |
435 |
|
Mahal. Distance |
2.591 |
30.131 |
9.977 |
4.908 |
435 |
|
Cook's Distance |
.000 |
.144 |
.003 |
.009 |
435 |
|
Centered Leverage Value |
.006 |
.069 |
.023 |
.011 |
435 |
|
Table 5: Tests of Normality |
|||
|
|
Kolmogorov-Smirnova |
|
|
|
|
Statistic |
df |
Sig. |
|
Unstandardized Residual |
.042 |
435 |
.069 |
|
a. Lilliefors Significance Correction |
|||
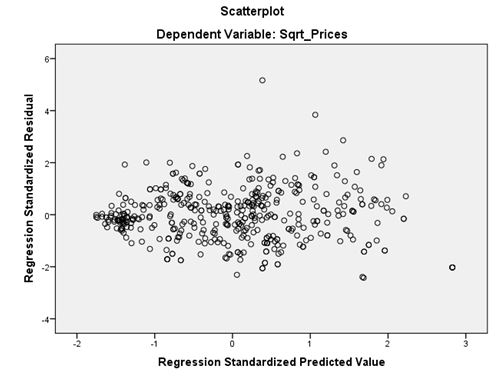
The scatter plot of residuals is given below and it does not portray any obvious pattern. That means these residuals are equally distributed above and below zero on X-axis, and to the left and right of zero on the Y-axis.
The study is looking to explain the revealed factors which are being considered in determining the house prices. Based on the hedonic pricing model, the factors identified through various past studies in a different context. This study has attempted to see the impact of those factors in price determination of residential properties in Karachi. The study has taken three dimensions of property that include structural attributes, locational attributes, and environmental attributes. These three factors have further sub-dimensions in which structural attributes included, Age of Property (In Years), Covered area (Sq./yards), Number of Bed Rooms, Number of Bath Rooms, Direction; West=1; Non-west =0, Parking Facility (Yes=1 and No=0), locational attributes included, Proximity to city center (Distance in Km), No. of Schools within area, Nearest Hospital in Km, Availability of Commercial Area (Yes=1, No=0) and environmental attribute consist of Proximity to Industrial Area (Distance in KM), Availability of Sewerage System (Yes=1 and No=0) and No. of parks within area variables or factors that were considered for study. Based on these factors table 7 is showing model summary and it can be seen the explanatory power of these variables is 79% which is significant as well. However, overall model fitness can be observed through table 8 and the results are showing that the model is good for the prediction of the dependent variable.
|
Table 7. Model Summary b |
|||||||||||
|
Model |
R |
R Square |
Adjusted R Square |
Std. The error of the Estimate |
Change Statistics |
||||||
|
R Square Change |
F Change |
df1 |
df2 |
Sig. F Change |
|||||||
|
1 |
.892a |
.796 |
.791 |
1116.01642 |
.796 |
165.030 |
10 |
424 |
.000 |
||
|
a. Predictors: (Constant), No of parks within area, Covered area in Sqyards, Direction, Nearest Hospital in Km, Age of Property In Years, Proximity to Industrial Area Distance in KM, Number of Bed Rooms, Proximity to city center Distance in Km, No of Schools within area, Number of Bath Rooms |
|||||||||||
|
b. Dependent Variable: Sqrt_Prices
|
|||||||||||
|
Table 8.ANOVA a |
|||||||||||
|
Model |
Sum of Squares |
df |
Mean Square |
F |
Sig. |
||||||
|
1 |
Regression |
2055440359.554 |
10 |
205544035.955 |
165.030 |
.000b |
|||||
|
Residual |
528088879.380 |
424 |
1245492.640 |
|
|
||||||
|
Total |
2583529238.934 |
434 |
|
|
|
||||||
|
a. Dependent Variable: Sqrt_Prices |
|||||||||||
|
b. Predictors: (Constant), No of parks within area, Covered area in Sqyards, Direction, Nearest Hospital in Km, Age of Property In Years, Proximity to Industrial Area Distance in KM, Number of Bed Rooms, Proximity to city center Distance in Km, No of Schools within area. |
|||||||||||
|
Model |
Unstandardized Coefficients |
Standardized Coefficients |
t |
Sig. |
Collinearity Statistics |
|||
|
B |
Std. Error |
Beta |
Tolerance |
VIF |
||||
|
1 |
(Constant) |
3402.854 |
455.339 |
|
7.473 |
.000 |
|
|
|
Age of Property In Years |
-35.357 |
8.749 |
-.107 |
-4.041 |
.000 |
.683 |
1.463 |
|
|
Covered area Sqyards |
5.113 |
.217 |
.722 |
23.519 |
.000 |
.512 |
1.952 |
|
|
Number of Bed Rooms |
189.832 |
97.196 |
.094 |
1.953 |
.051 |
.210 |
4.767 |
|
|
Number of Bath Rooms |
153.363 |
86.674 |
.086 |
1.769 |
.078 |
.205 |
4.872 |
|
|
Direction West=1 Non-west=0 |
-92.699 |
158.271 |
-.013 |
-.586 |
.558 |
.935 |
1.069 |
|
|
Proximity to city center Distance in Km |
-40.801 |
42.670 |
-.033 |
-.956 |
.340 |
.398 |
2.515 |
|
|
No of Schools within area |
-46.879 |
19.245 |
-.095 |
-2.436 |
.015 |
.318 |
3.141 |
|
|
Nearest Hospital in Km |
-258.899 |
70.176 |
-.130 |
-3.689 |
.000 |
.391 |
2.557 |
|
|
Proximity to Industrial Area Distance in KM |
305.132 |
40.173 |
.216 |
7.596 |
.000 |
.596 |
1.679 |
|
|
No. of parks within area |
92.695 |
25.876 |
.141 |
3.582 |
.000 |
.311 |
3.215 |
|
Table 9 is showing the value of the coefficient but before going to interpret those coefficients, assumption of non-multi-collinearity can be witnessed through the given table and as VIF values are below 5 that means there is no problem of multi-collinearity in the data. This model confirmed that the among structural factors, age of the property, covered area and number of rooms are significant in price determination. In addition to these factors from locational attributes, the number of schools, nearest hospitals are significant and from environmental factors, proximity to industrial area and number of parks are significant. Table 8 is showing that the coefficient of these variables hasa p-value of less than 0.05. So seven hypothesis rejected and three have been failed to reject. The above results can also be expressed in the following equation.
lnPi= 3402.854- .107Age of house(i)+ 0.722covered area(i)+ 0.094 No.of bedrooms(i) +.086 No.of bath rooms(i)- .013directon(i)- .033 proximity to city center(i)- .095No.of schools(i)- .130 Nearest hospitals(i)+.216 Proximity to industrial area(i)+.141No.of Parks(i)+ ε
The study was aiming to explain the impact of factors that give maximum pleasure to residents, on price determination of residential property. In order to achieve the research objective, the study has adopted a model that is known as a hedonic pricing model. Based on that model, the study has identified the most significant variables that play an important role in price determination of residential property. As per the statistical results, among structural attributes, age of house has a negative significant impact on price determination of residential properties and the coefficient value is -0.107. In addition to that covered area and number of bedrooms have a positive significant impact of house prices and the coefficients of covered area and bedrooms number are 0.722 and 0.094 respectively. These results are aligned with the past studies as Randeniya et al., (2017) attempted to estimate the implicit values of housing attributes by applying the hedonic pricing method. The study has found the positive significant importance of structural attributes. Yixiong et al., (2017) have studied these factors in china and found these factors significant. These structural attributes were studied by (Arimah, 1992; Fierro et. al, 2009; Laakso&Loikkanen, 1995; Tan, 2012b; Tiwari & Parikh, 1998; Tse& Love, 2000; Wilhelmsson, 2000 as cited in Saw and Tan, 2014). However, the results related to covered area contradicts with some studies those have revealed the small size of properties are also preferred by some investors because of the quick turn over and attractive turn over (Kohler, 2013). The age of house has found as a negative significant variable for price determination and that is also in line with the past studies (Chiang et al., 2015; Forrest, Glen & Ward, 1996; Oloke et al., 2013). These results are suggesting that the investors of residential property must consider these factor in order to get high returns on their investment. The residents are willing to pay more for the newly built house and larger the covered area. However, the direction of the house is not that much important. Locational attributes were studied by many studies and found these factors as significant. This study has also revealed that the number of schools within the area and nearest hospitals have a significant impact. The coefficient value for these two variables is negative that means more near the school and hospital lesser will be the price value. The accessibilities to various facilities are considered as positive significant factors for price determinations however few studies had found negative significance because of the noise pollution & overcrowded areas (Heikkila et al. 1989; Hoch & Waddell 1993; Kain& Quigley 1970; Song &Knaap, 2003). The results of this study have a contradiction with the inference of past studies which had shown the positive significant impact of these factors on house prices. Dziauddin& Idris (2018) attempted to assess the relative importance of structural and locational effects on residential property values in Metropolitan Kuala Lumpur and they found that locational attributes play significantly in price determinants of residential properties Study confirmed that the proximity to the city center and proximity to the forest are the most important attributes of location variables. this study has revealed contradicting results this study has proximity to the city center is not a significant factor. Locational attributes were studied by Huang & Yin, (2015) and they inferred that location variable is the proxy for travel cost and buyers will prefer the area from where they can have optimum traveling cost in order to have cheap and prompt accessibility towards railway station, school, hospitals, lakes, parks, and business centers. In regards to the environmental attributes, distance from industrial area and availability of the number of parks both have a positive and significant impact on the residential properties. These results are in aligned with most of the studies that had been done in the past. The impact of environment variable on price determination in the context of Turkey was also investigated and the study found its significant impact (Gizem et al., 2018). Various studies have taken environment factors in determining the value of housing prices and they found that buyer is willing to pay more for a property if the property is close to the green spaces, lakes, ponds as they want to have a good environment surrounding their properties (Schipperijn et al., 2010; Kienast et al., 2012). Households have attractiveness for natural scenery as it enhances the recreational benefits (Jim & Chen, 2006; Ozgüner&Kendle, 2006). The closer proximity of houses to green parks studied by using hedonic pricing model and study confirmed that green parks accompanied with recreational activities nearby the residential property has a positive significant impact on the house prices (Poudyal et al., 2009).
Real estate sector has successfully sought great attraction from local as well as foreign investors. The main purpose of attraction in this sector is high capital gains in a short span of time. People are highly optimistic about the investment in real estate, they considered it the safest zone to invest as compared to the stock market. This study has purposefully target price determinants so that investors can emphasize on those factors having a significant impact on house prices so that they can capitalize their investments. The study has revealed that new houses can attract more prices as compared to older. In addition to the age of the house, area of houses along with the number of rooms have a significant impact on prices. These factors are related to structural attributes and play a significant role as price determinants. In addition to structural attributes proximity to different amenities like schools, hospitals, and commercial areas play a vital role as price determinants of residential properties. However, this study has found these factors negatively significant and few studies have revealed these factors as a proxy for noise pollution so it can be inferred that residential properties should be away from city centers, schools, and hospitals. Further, the environmental attributes that include the distance from the industrial area and number of parks and both these dimensions havea positive significant impact on the house prices. The builders and investors should focus on these factors so they would be able to attract various investors locally as well as international. The implication of this research can be witnessed through ongoing projects in Karachi. Most of these projects are away from the city center and more importantly, residential zones are separated from the commercial zone. This research has been attempted to analyze the property specific factors in order to gauge the impact of these factors in price determination. However, these preferred factors can be overwhelmed by some economic factors too. So in the future,a study should be conducted to see the impact of these house specificfactors along with economic factors in order to capture a more comprehensive picture. This study can also be enhanced to include more areas and cities of Pakistan in order to get more robust results.
Abidoye, R. B., & Chan, A. P. (2016). Critical determinants of residential property value: Professionals’ perspective. Journal of Facilities Management, 14(3), 283-300.
Abidoye, R. B., & Chan, A. P. (2018). Hedonic Valuation of Real Estate Properties in Nigeria. Journal of African Real Estate Research, 3(1), 122-140.
Agostini, C. A., &Palmucci, G. A. (2008). The anticipated capitalisation effect of a new metro line on housing prices. Fiscal studies, 29(2), 233-256.
Ahmad, S. (2015). Housing demand and housing policy in urban Bangladesh. Urban Studies, 52(4), 738-755.
Ali, G., Bashir, M. K., & Ali, H. (2015). Housing valuation of different towns using the hedonic model: A case of Faisalabad city, Pakistan. Habitat International, 50, 240-249.
Burnside, C., Eichenbaum, M., &Rebelo, S. (2011). Understanding Booms and Busts in Housing Prices. mimeo Northwestern.
Case, K. E., & Shiller, R. J. (2003). Is there a bubble in the housing market?. Brookings papers on economic activity, 2003(2), 299-362.
Chen, J., Chang, K. T., Karacsonyi, D., & Zhang, X. (2014). Comparing urban land expansion and its driving factors in Shenzhen and Dongguan, China. Habitat International, 43, 61-71.
Chiang, Y. H., Peng, T. C., & Chang, C. O. (2015). The nonlinear effect of convenience stores on residential property prices: A case study of Taipei, Taiwan. Habitat International, 46, 82-90.
Cho, S. H., Bowker, J. M., & Park, W. M. (2006). Measuring the contribution of water and green space amenities to housing values: An application and comparison of spatially weighted hedonic models. Journal of agricultural and resource economics, 485-507.
Choy, L. H., Mak, S. W., & Ho, W. K. (2007). Modeling Hong Kong real estate prices. Journal of Housing and the Built Environment, 22(4), 359-368.
Concas, S. (2013). Accessibility and housing price resilience: Evidence from limited-access roadways in Florida. Transportation Research Record, 2357(1), 66-76.
Das, A., Senapati, M., & John, J. (2009). Hedonic quality adjustments for real estate prices in India. Reserve Bank of India Occasional Papers, 30.
Dziauddin, M. F., & Idris, Z. (2018). Assessing the relative importance of structural and locational effects on residential property values in Metropolitan Kuala Lumpur. Pacific Rim Property Research Journal, 24(1), 49-70.
Forrest, D., Glen, J., & Ward, R. (1996). The impact of a light rail system on the structure of house prices: a hedonic longitudinal study. Journal of Transport Economics and Policy, 15-29.
Geltner, D., MacGregor, B. D., & Schwann, G. M. (2003). Appraisal smoothing and price discovery in real estate markets. Urban Studies, 40(5-6), 1047-1064.
Glaeser, E. L., Kominers, S. D., Luca, M., &Naik, N. (2018). Big data and big cities: The promises and limitations of improved measures of urban life. Economic Inquiry, 56(1), 114-137.
Goodhart, C., & Hofmann, B. (2008). House prices, money, credit, and the macroeconomy. Oxford Review of Economic Policy, 24(1), 180-205.
Hayrullahoğlu, G., Aliefendioğlu, Y., Tanrıvermiş, H., &Hayrullahoğlu, A. C. (2018). Estimation of the hedonic valuation model in housing markets: the case of cukurambar region in cankaya district of ankara province. Ecoforum Journal, 7(1).
He, S., & Wu, F. (2009). China's emerging neoliberal urbanism: Perspectives from urban redevelopment. Antipode, 41(2), 282-304.
Heikkila, E., Gordon, P., Kim, J. I., Peiser, R. B., Richardson, H. W., & Dale-Johnson, D. (1989). What happened to the CBD-distance gradient?: land values in a policentric city. Environment and planning A, 21(2), 221-232.
Hoch, I., & Waddell, P. (1993). Apartment rents: another challenge to the monocentric odel. Geographical Analysis, 25(1), 20-34.
Huang, H., & Yin, L. (2015). Creating sustainable urban built environments: An application of hedonic house price models in Wuhan, China. Journal of Housing and the Built Environment, 30(2), 219-235.
Hui, E. C., & Yue, S. (2006). Housing price bubbles in Hong Kong, Beijing and Shanghai: a comparative study. The Journal of Real Estate Finance and Economics, 33(4), 299-327.
Hui, E. C., Chau, C. K., Pun, L., & Law, M. Y. (2007). Measuring the neighboring and environmental effects on residential property value: Using spatial weighting matrix. Building and environment, 42(6), 2333-2343.
Hurtubia, R., Gallay, O., &Bierlaire, M. (2010). Attributes of households, locations and real-estate markets for land use modeling. SustainCity Deliverable, 2, 1-27.
Hussain, T., Abbas, J., Wei, Z., &Nurunnabi, M. (2019). The Effect of Sustainable Urban Planning and Slum Disamenity on The Value of Neighboring Residential Property: Application of The Hedonic Pricing Model in Rent Price Appraisal. Sustainability, 11(4), 1144.
Jim, C. Y., & Chen, W. Y. (2006). Perception and attitude of residents toward urban green spaces in Guangzhou (China). Environmental management, 38(3), 338-349.
Kain, J. F., & Quigley, J. M. (1970). Evaluating the quality of the residential environment. Environment and Planning A, 2(1), 23-32.
Khan, P. A. M., Azmi, A., Juhari, N. H., Khair, N., &Daud, S. Z. (2017). Housing preference for first time home buyer in Malaysia. International Journal of Real Estate Studies, 11(2), 1-6.
Kienast, F., Degenhardt, B., Weilenmann, B., Wäger, Y., &Buchecker, M. (2012). GIS-assisted mapping of landscape suitability for nearby recreation. Landscape and Urban Planning, 105(4), 385-399.
Lancaster, K. J. (1966). A new approach to consumer theory. Journal of political economy, 74(2), 132-157.
Li, H., Wei, Y. D., Wu, Y., & Tian, G. (2019). Analyzing housing prices in Shanghai with open data: Amenity, accessibility and urban structure. Cities, 91, 165-179.
Liu, Y., Yue, W., Fan, P., & Song, Y. (2015). Suburban residential development in the era of market-oriented land reform: The case of Hangzhou, China. Land Use Policy, 42, 233-243.
Mihaescu, O., &VomHofe, R. (2012). The impact of brownfields on residential property values in Cincinnati, Ohio: A spatial hedonic approach. Journal of Regional Analysis & Policy, 42(3), 223-236.
Moghimi, V., &Jusan, M. B. M. (2015). Priority of structural housing attribute preferences: identifying customer perception. International Journal of Housing Markets and Analysis, 8(1), 36-52.
MohdThasThaker, H., & Chandra Sakaran, K. (2016). Prioritisation of key attributes influencing the decision to purchase a residential property in Malaysia: An analytic hierarchy process (AHP) approach. International Journal of Housing Markets and Analysis, 9(4), 446-467.
Nelson, R. A., Tanguay, T. L., & Patterson, C. D. (1994). A quality-adjusted price index for personal computers. Journal of Business & Economic Statistics, 12(1), 23-31.
Ohta, M., &Griliches, Z. (1976). Automobile prices revisited: Extensions of the hedonic hypothesis. In Household production and consumption (pp. 325-398). NBER.
Oloke, C. O., Simon, R. F., &Adesulu, A. F. (2013). An examination of the factors affecting residential property values in Magodoneighbourhood, Lagos state. International Journal of Economy, Management and Social Sciences, 2(8), 639-643.
Özgüner, H., &Kendle, A. D. (2006). Public attitudes towards naturalistic versus designed landscapes in the city of Sheffield (UK). Landscape and urban planning, 74(2), 139-157.
Randeniya, T. D., Ranasinghe, G., &Amarawickrama, S. (2017). A model to estimate the implicit values of housing attributes by applying the hedonic pricing method. International Journal of Built Environment and Sustainability, 4(2).
Rosen, S. (1974). Hedonic prices and implicit markets: product differentiation in pure competition. Journal of political economy, 82(1), 34-55.
Schipperijn, J., Ekholm, O., Stigsdotter, U. K., Toftager, M., Bentsen, P., Kamper-Jørgensen, F., &Randrup, T. B. (2010). Factors influencing the use of green space: Results from a Danish national representative survey. Landscape and urban planning, 95(3), 130-137.
Silver, M., &Heravi, S. (2001). Scanner data and the measurement of inflation. The Economic Journal, 111(472), 383-404.
Song, Y., &Knaap, G. J. (2003). New urbanism and housing values: a disaggregate assessment. Journal of Urban Economics, 54(2), 218-238.
Sun, C., Meng, X., & Peng, S. (2017). Effects of waste-to-energy plants on China’s urbanization: Evidence from a hedonic price analysis in Shenzhen. Sustainability, 9(3), 475.
Tian, G., Wei, Y. D., & Li, H. (2017). Effects of accessibility and environmental health risk on housing prices: A case of Salt Lake County, Utah. Applied geography, 89, 12-21.
Tse, R. Y., & Love, P. E. (2000). Measuring residential property values in Hong Kong. Property Management, 18(5), 366-374.
Wen, H., & Tao, Y. (2015). Polycentric urban structure and housing price in the transitional China: Evidence from Hangzhou. Habitat International, 46, 138-146.
Wen, H., Zhang, Y., & Zhang, L. (2014). Do educational facilities affect housing price? An empirical study in Hangzhou, China. Habitat International, 42, 155-163.
Wu, C., Ye, X., Ren, F., Wan, Y., Ning, P. and Du, Q., 2016. Spatial and social media data analytics of housing prices in Shenzhen, China. PloS one, 11(10), p.e0164553.
Xiao, Y., Chen, X., Li, Q., Yu, X., Chen, J., &Guo, J. (2017). Exploring determinants of housing prices in Beijing: an enhanced hedonic regression with open access POI data. ISPRS International Journal of Geo-Information, 6(11), 358.
Zhang, X., Liu, X., Hang, J., Yao, D., & Shi, G. (2016). Do urban rail transit facilities affect housing prices? Evidence from China. Sustainability, 8(4), 380.

